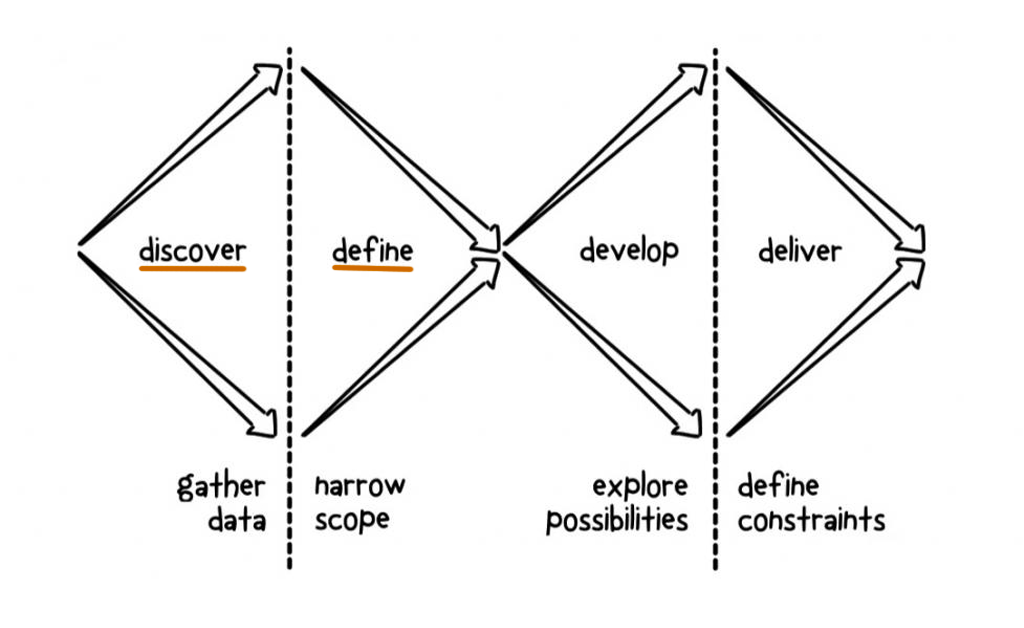
Our team follows the double diamond approach to design thinking and innovation. During this project, we cover the first diamond.

Mellisa Hankins
Product designer + developer
Understanding the current landscape that enables student progress
User research / CX
Role
Lead UX Designer, ESA
Stakeholder management, workshops, user research strategy, analysis, ideation
Duration: 6 months
Team
2 Business Analysts
2 UX Designers
1 Subject Matter Expert
1 External User Researcher Team
2 External Organisations (ACARA & AITSL)
Project
Online Formative Assessment Initiative
Client: Department of Education
Users: Teachers, school leaders, parents and students
Background
In response to the Through Growth to Achievement: Report of the Review to Achieve Excellence in Australian Schools (Excellence Review), our team were tasked with uncovering the major problems teachers, school leaders, students and parents, as well as system owners and resource vendors, in supporting student progress and achievement by understanding the current landscape of teaching and learning in detail. Our other task was to find a solution - what could a useful on-demand student learning assessment tool look like?
My role as the Lead UX Designer was to create and oversee the plan, establishing a strong foundation for the user research and lead analysis grounded in the subject matter at hand, education and assessment. The structure of our design thinking workshops held with different stakeholders were organised by me to validate our plans, research and eventually the analysis and outputs, as well as encourage ideation with users at the center.
It's simple when you have a plan
My first task as Lead UX Designer was to establish a user research framework, a detailed living plan listing out all the objectives, target users, segmentation criteria, analysis methodology and supporting documentation, including discussion guides for each user type.
As our team was studying the whole landscape, the feedback from other external project members from different organisations was valuable as they gave insight to their more specialised areas. Together we established an agreed set of discussion guides as a starting point to our external user research team.
In Australia, education is handled differently depending on state and sector (public, private and Catholic schools), hence a multi-modal research approach was designed by our researchers to gain insight to as many different processes, goals, behaviours and eventual trends as possible. This included:
Workshops
In-depth interviews
Working sessions
Ethnography sessions
Focus groups
Field research
Surveys
Gap analysis
Although I was only directly involved in workshops, field research and gap analysis, I was a second moderator on a few interviews and led the analysis on all data collected during the user research.
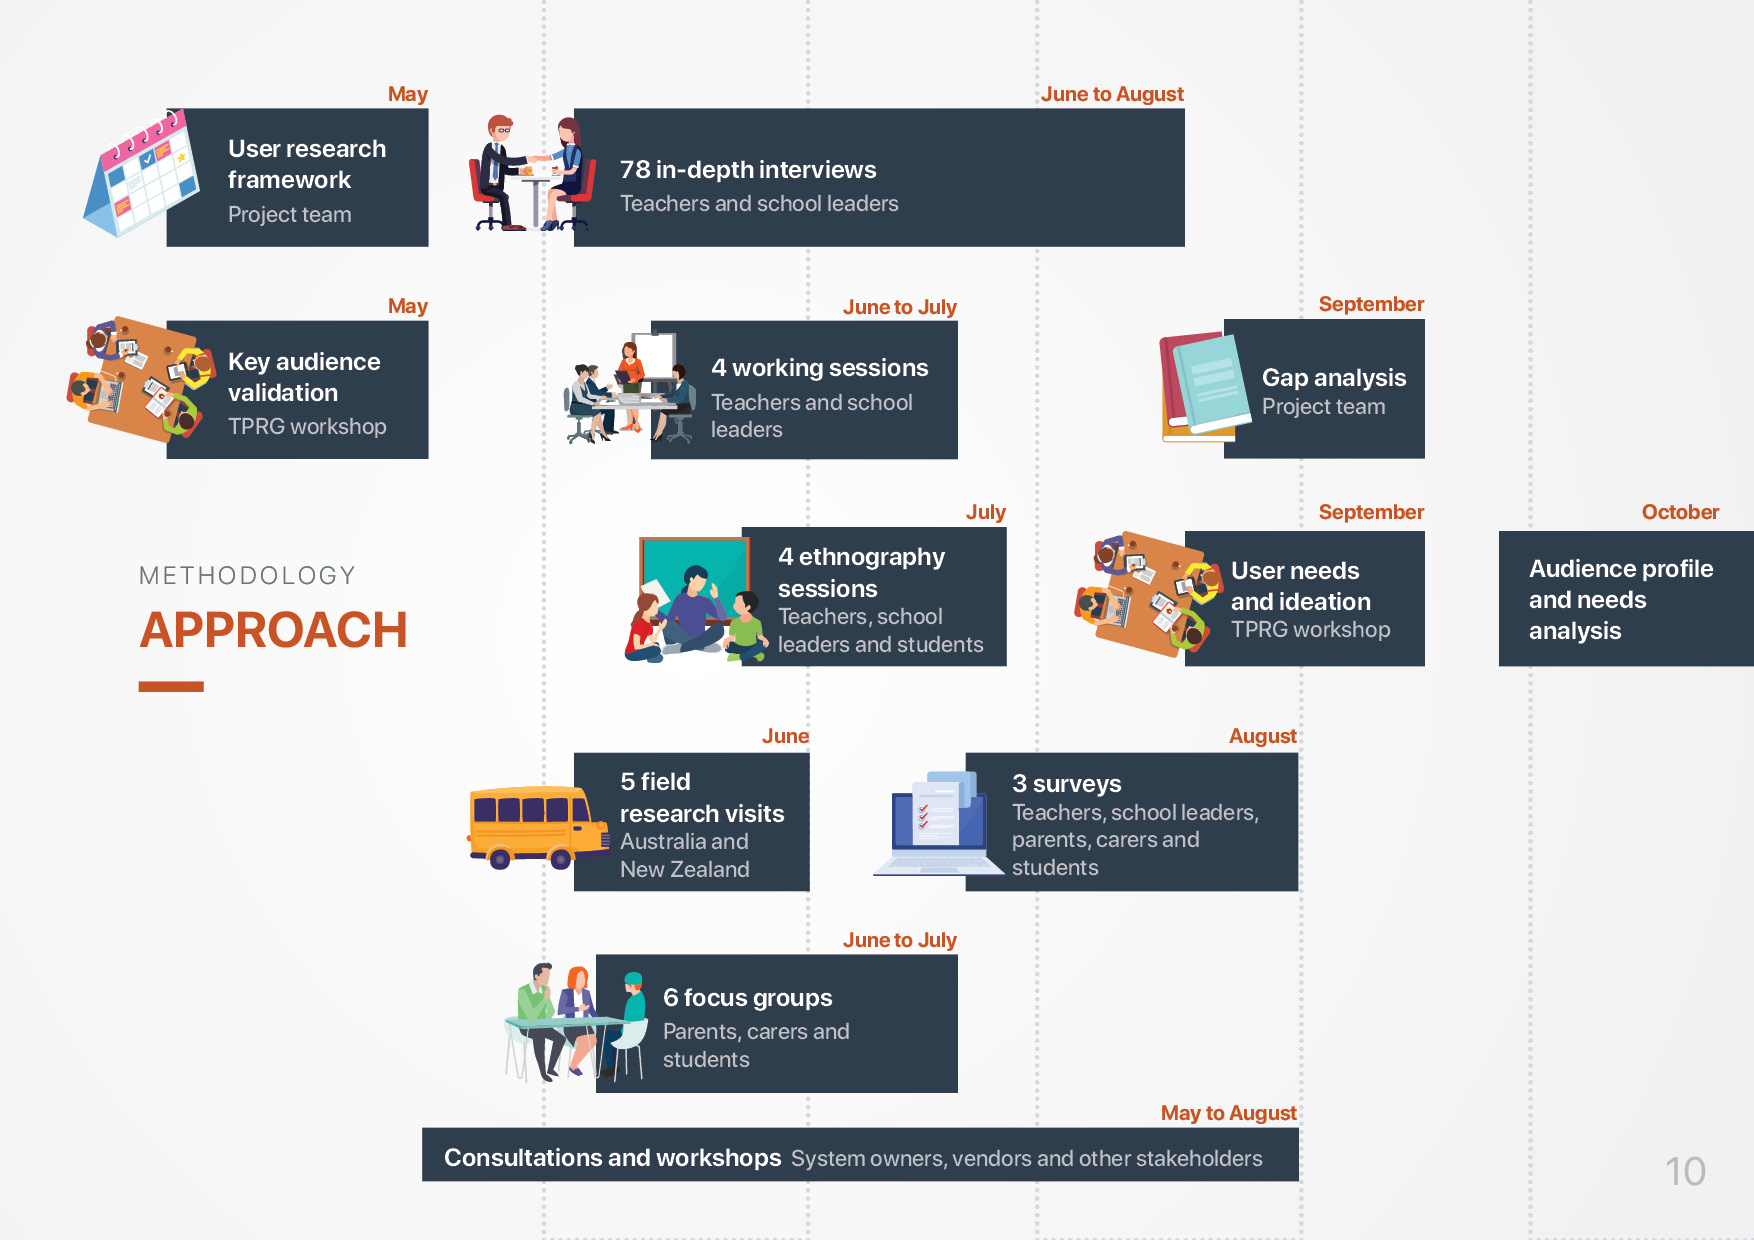
The timeline and scope we followed during the research phase
Validating the framework with our users
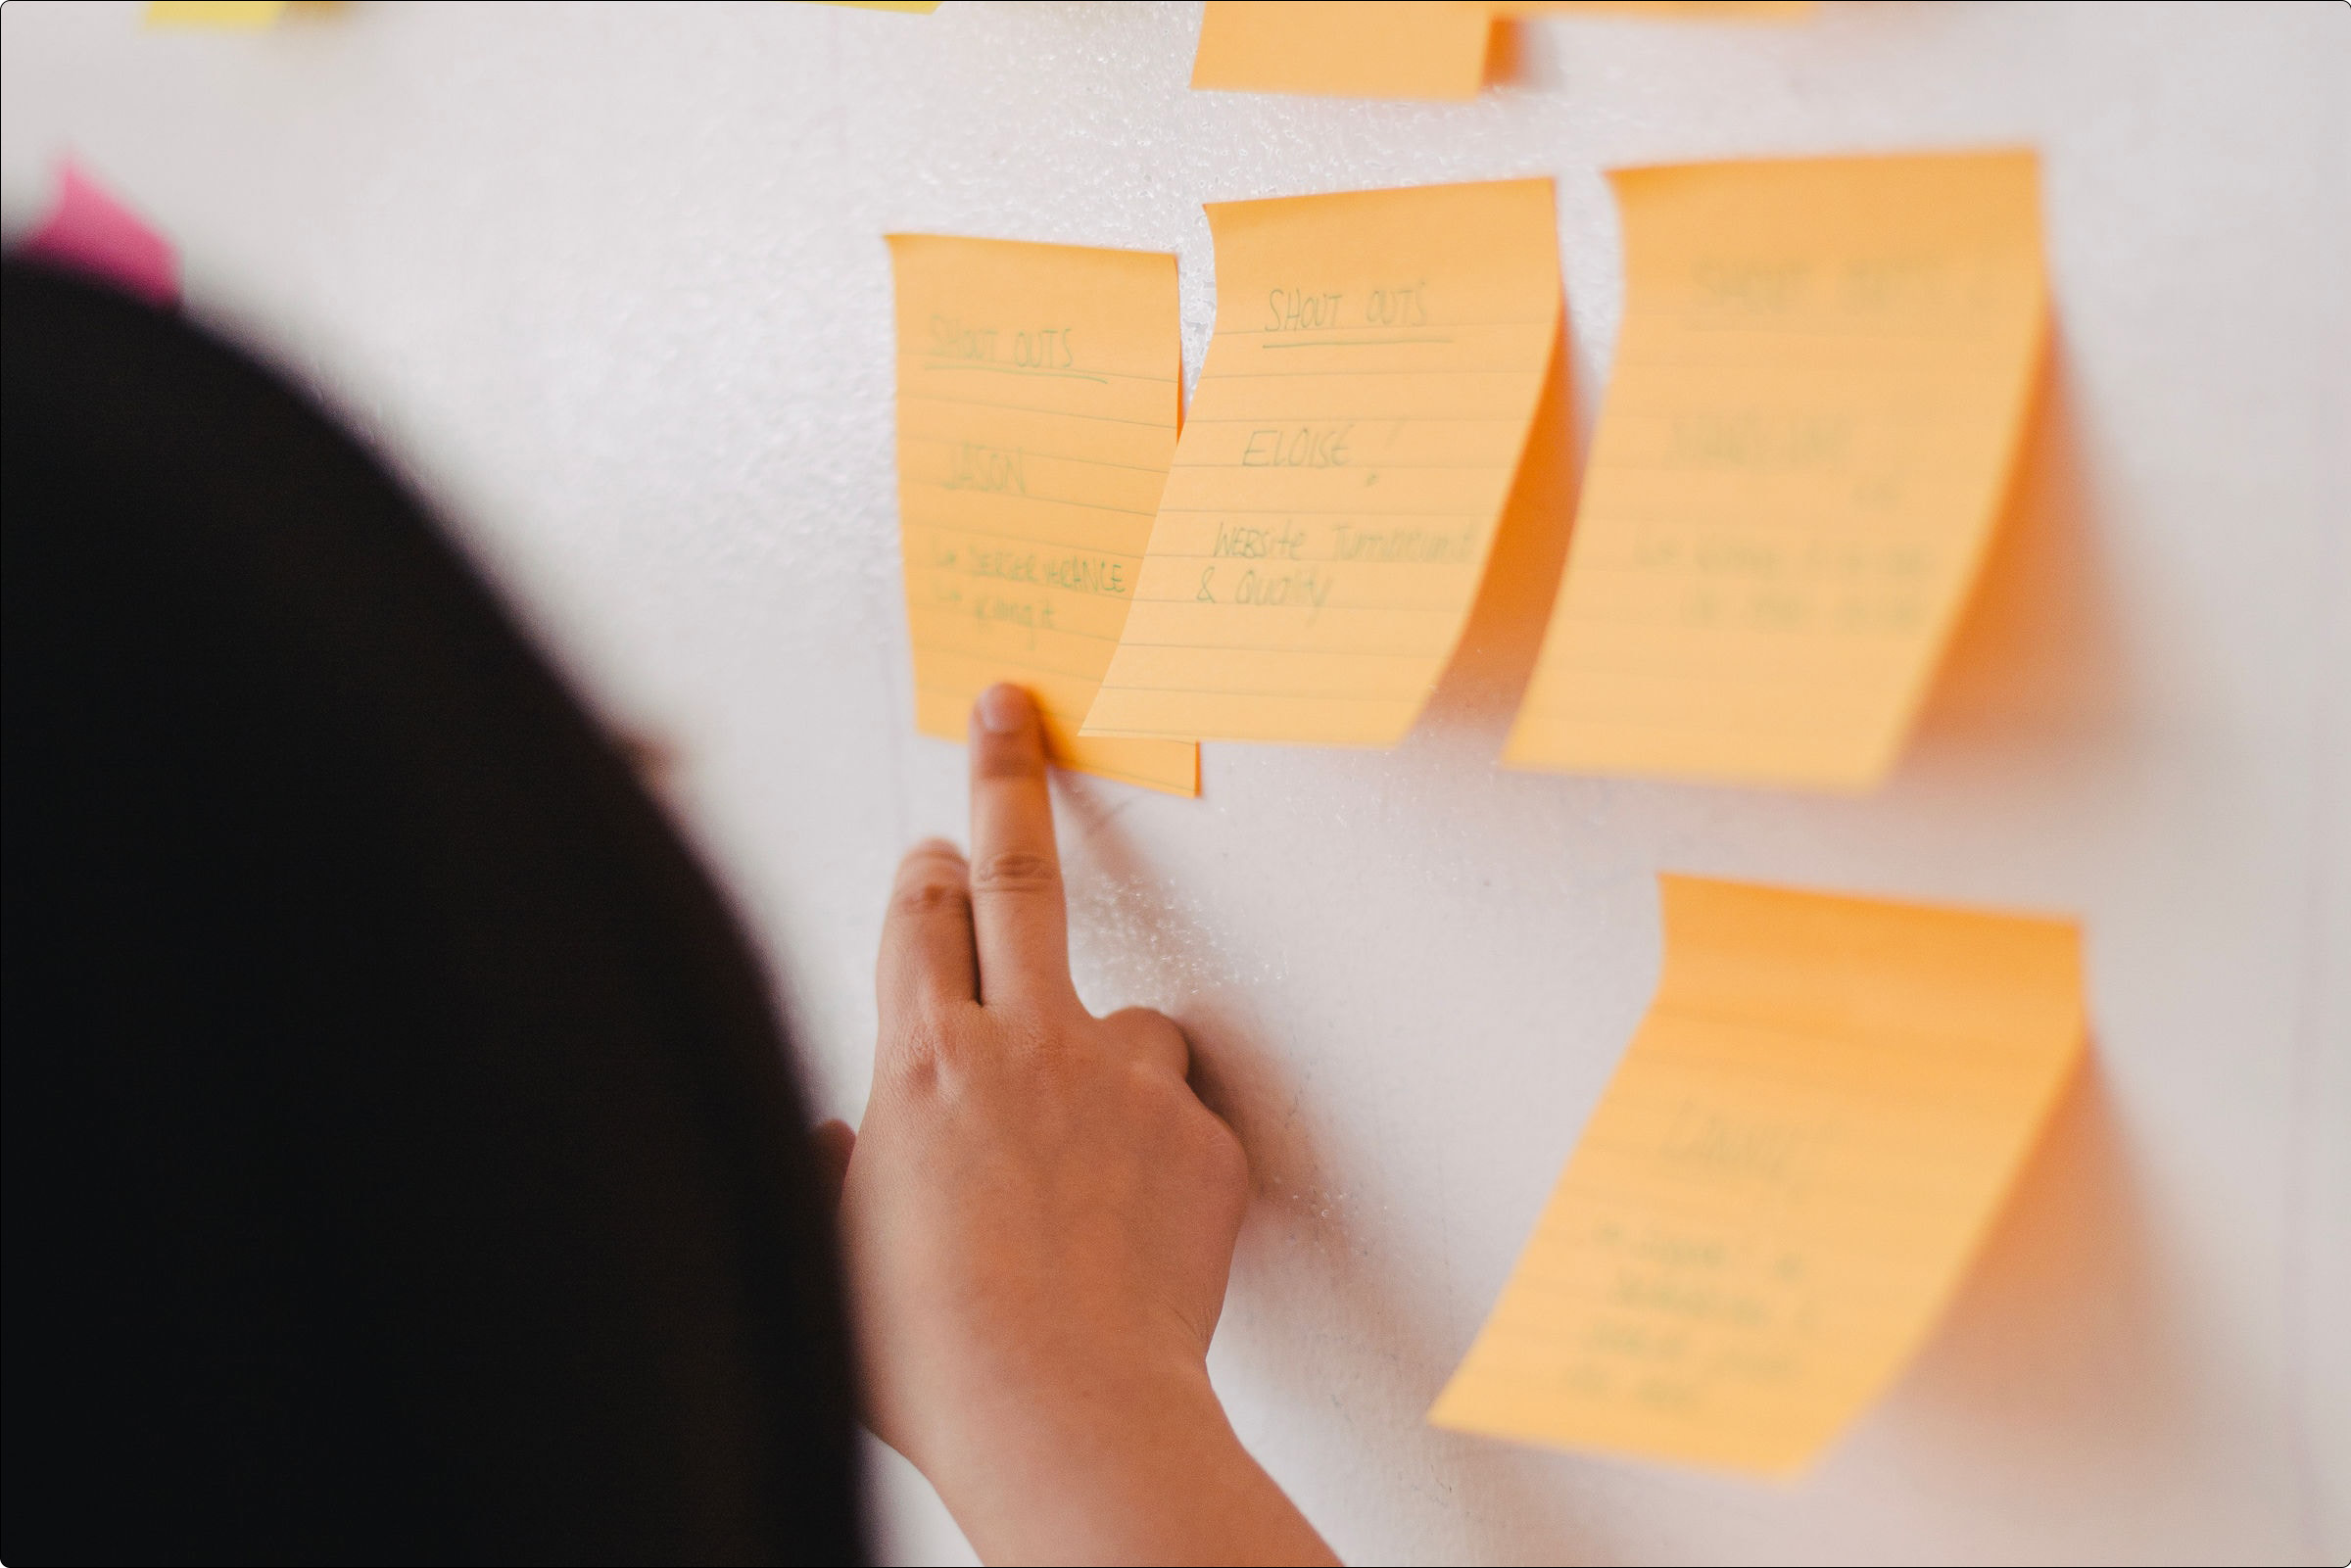
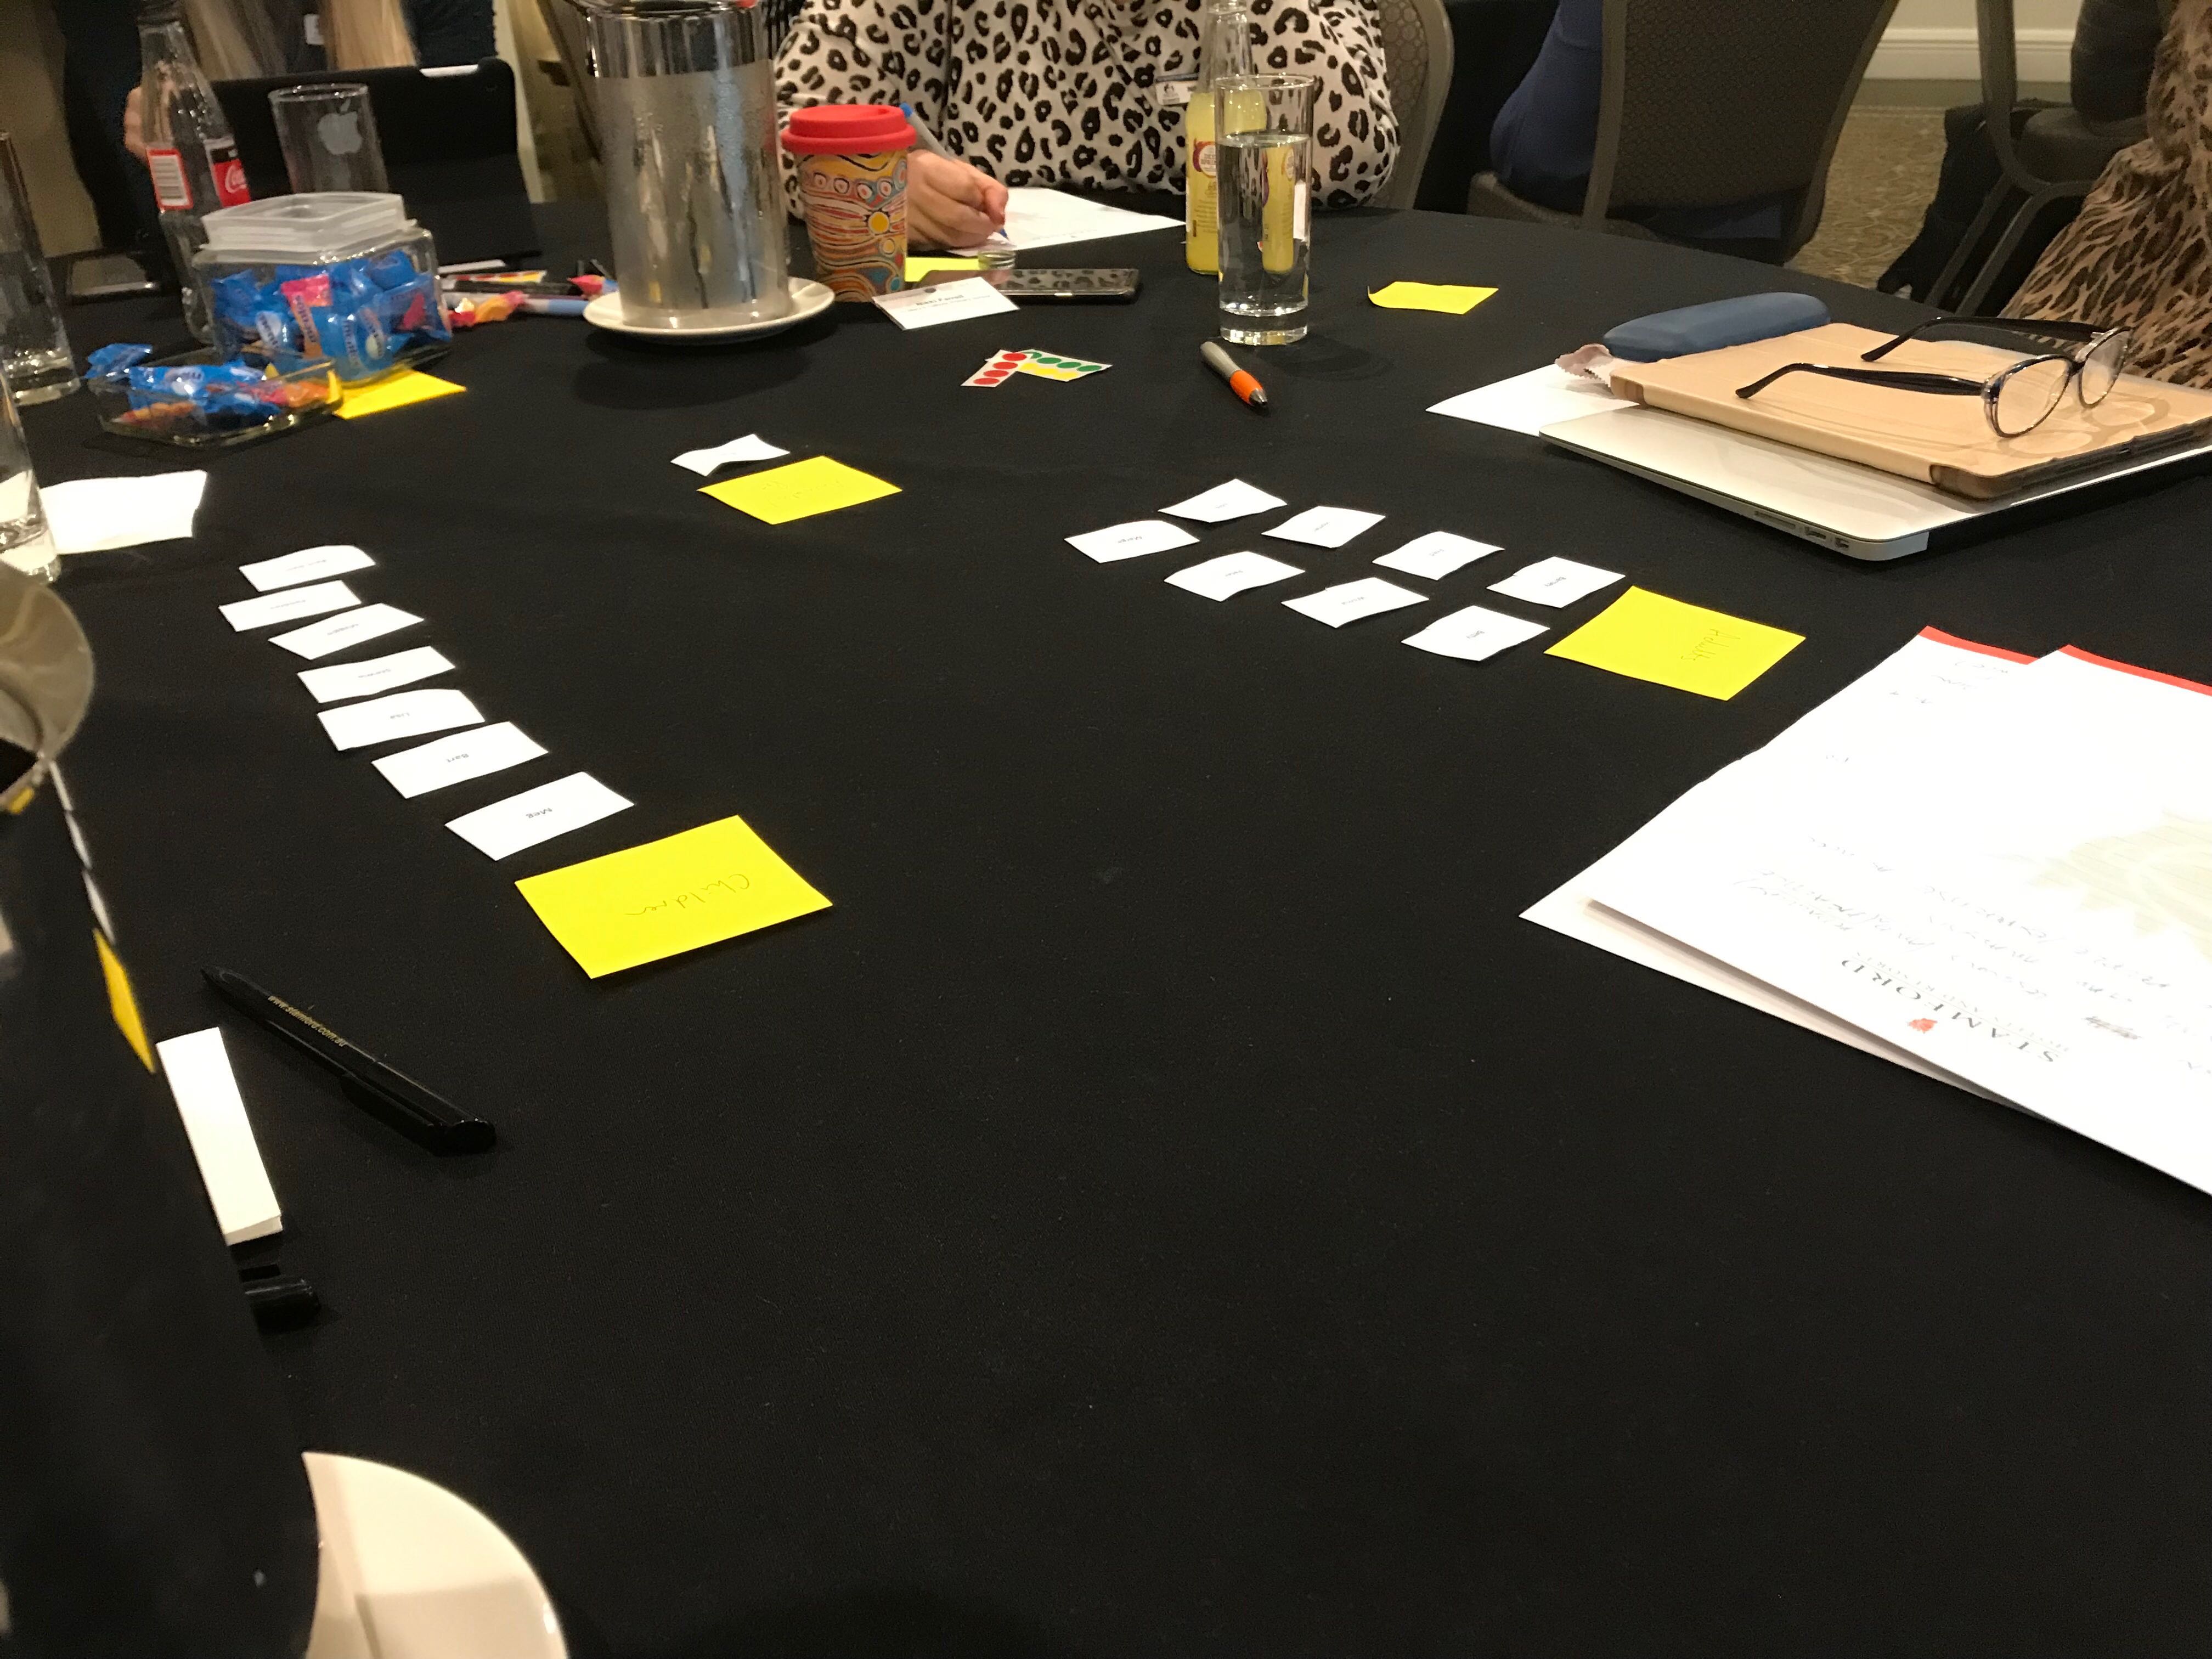
Before the user research went into full throttle, we tested our discussion guide with a reference group involving teachers and school leaders in a workshop format. The 27 members of the reference group were flown from all over Australia to Melbourne, to participate in a workshop we hosted in partnership with other organisations also working in the project.
I led two workshops to validate the discussion guides: a Persona workshop and Journey mapping workshop. The outputs from these two workshops became our baseline for the user research and analysis phase.
Persona workshop
The participants were split into five groups based on a segment that best fit them. They were tasked with creating a user that best described their shared experience and background, even drawing a picture of this user to show their emotion. Each group had one facilitator to encourage conversation and help users understand the task at hand, which they did admirably. This exercise help the design team understand the similarities and differences in their goals, motivations and processes.
Journey mapping workshop
In the same groups, participants worked on journey maps that included their shared experiences, including actions, pain points, happy moments, and influences. The same facilitator moderated this activity and provided the initial phases to journey map within. It was encouraging to see the users at this point come to understand the similarities between themselves, however also noting the differences and the factors that drove those.
Learning from our users
Whilst a separate team of specialist user researchers conducted interviews, working sessions, ethnography research and focus groups, I worked with the lead business analyst and a subject-matter expert to study existing tools as user researchers provided us feedback.
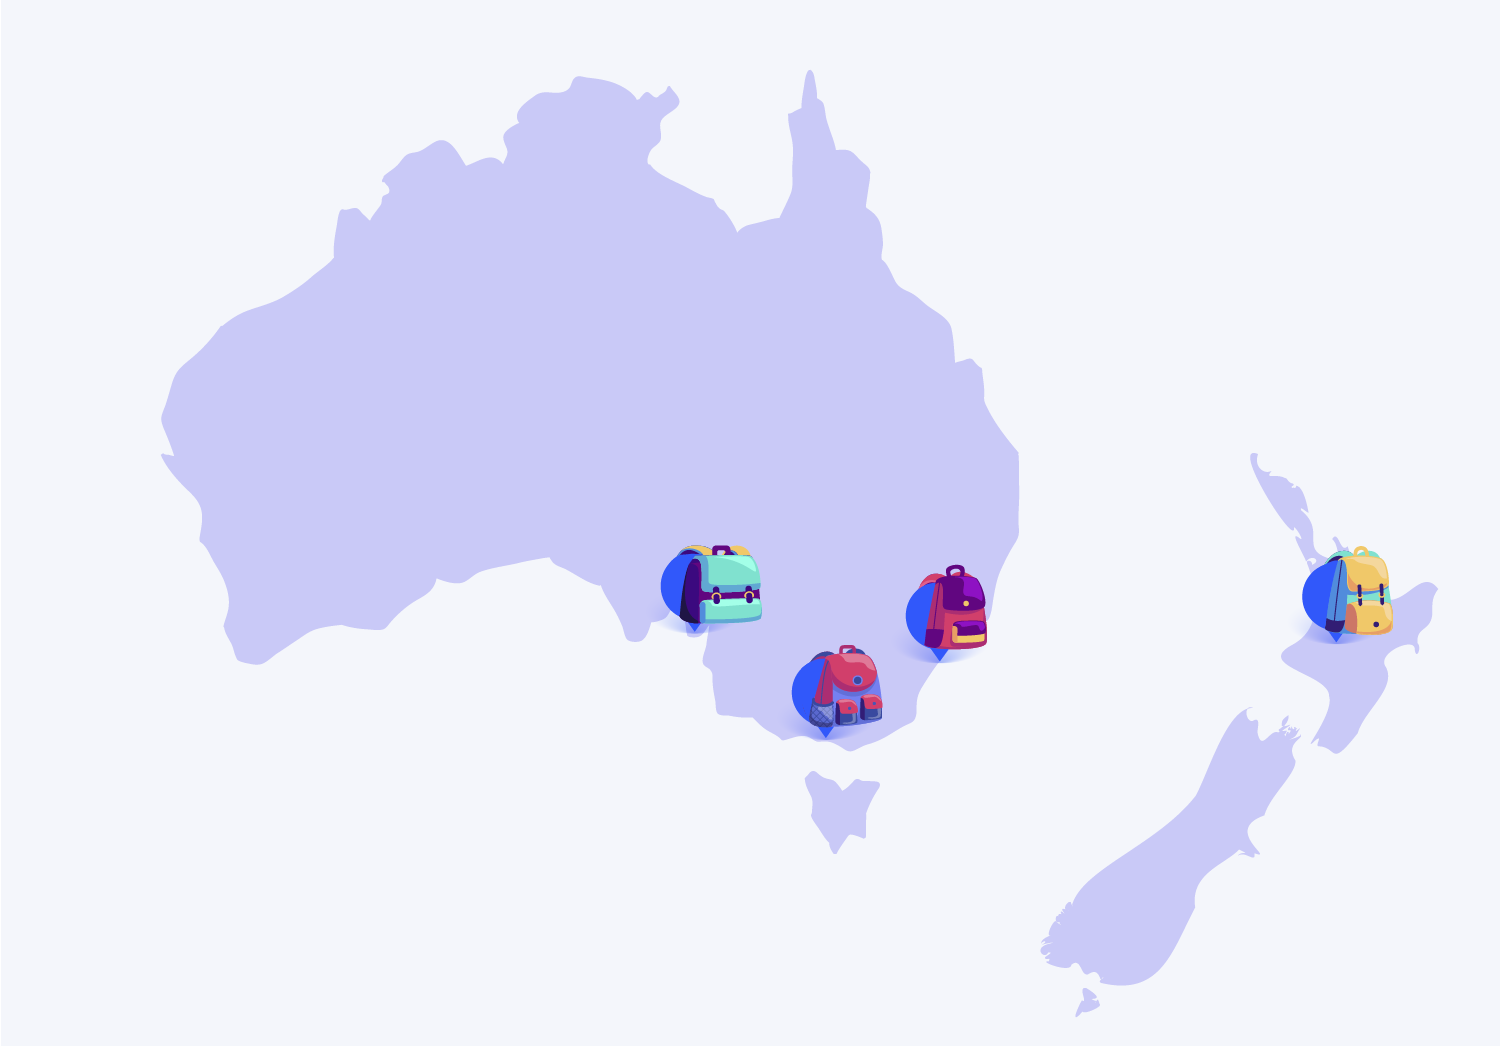
In parallel, we went out and visited five schools across Australia and in Auckland, New Zealand to view how these tools were being used in a school setting. We were told, and also showed and observed, what was working and not working, gathering data on what could potentially be improved and gaps that should be addressed. It was an eye-opening experience for our team, and a highlight of the project.
Digesting all of it
The amount of data collected during the user research phase was massive! We had representation from over 800 of our target users. That's a lot of data! But we relished the learnings we would receive.
I took the initiative to find a tool that could help us with this task, and came across Dovetail. I onboarded the team and established a process for coding data and added a second round of moderation, where after one piece of data was coded, another team member would overlook it and ensure the codes were consistent and as complete as possible. Every three days at least two people would code one together (pair coding). This would help limit the amount of bias without our findings.
Within Dovetail, we first coded the interviews and focus groups from transcripts and audio recordings provided. Trends and patterns began to emerge, which were validated via the working session and ethnography session data and further validated with a wider audience through surveys. The team also looked back and made sure we covered everything through gap analysis of related documents, including the original review.
These trends and patterns were collated into different outputs: personas and user journey maps.
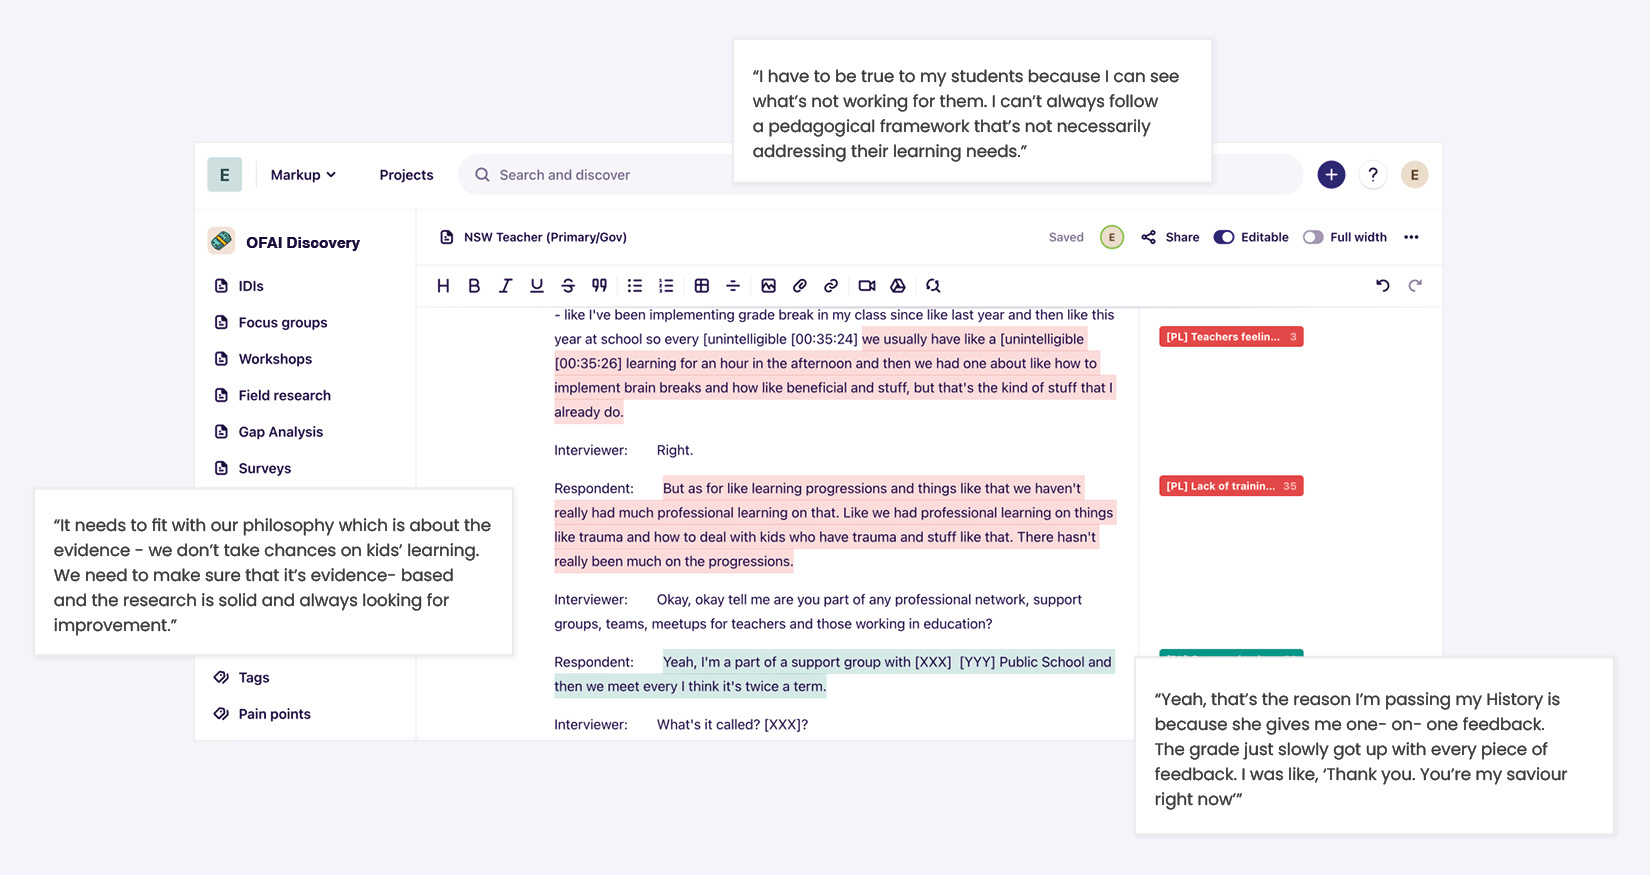
Dovetail was our main analysis tool due to the amount of data, where qualitative coding
techniques was adopted the by the design team.
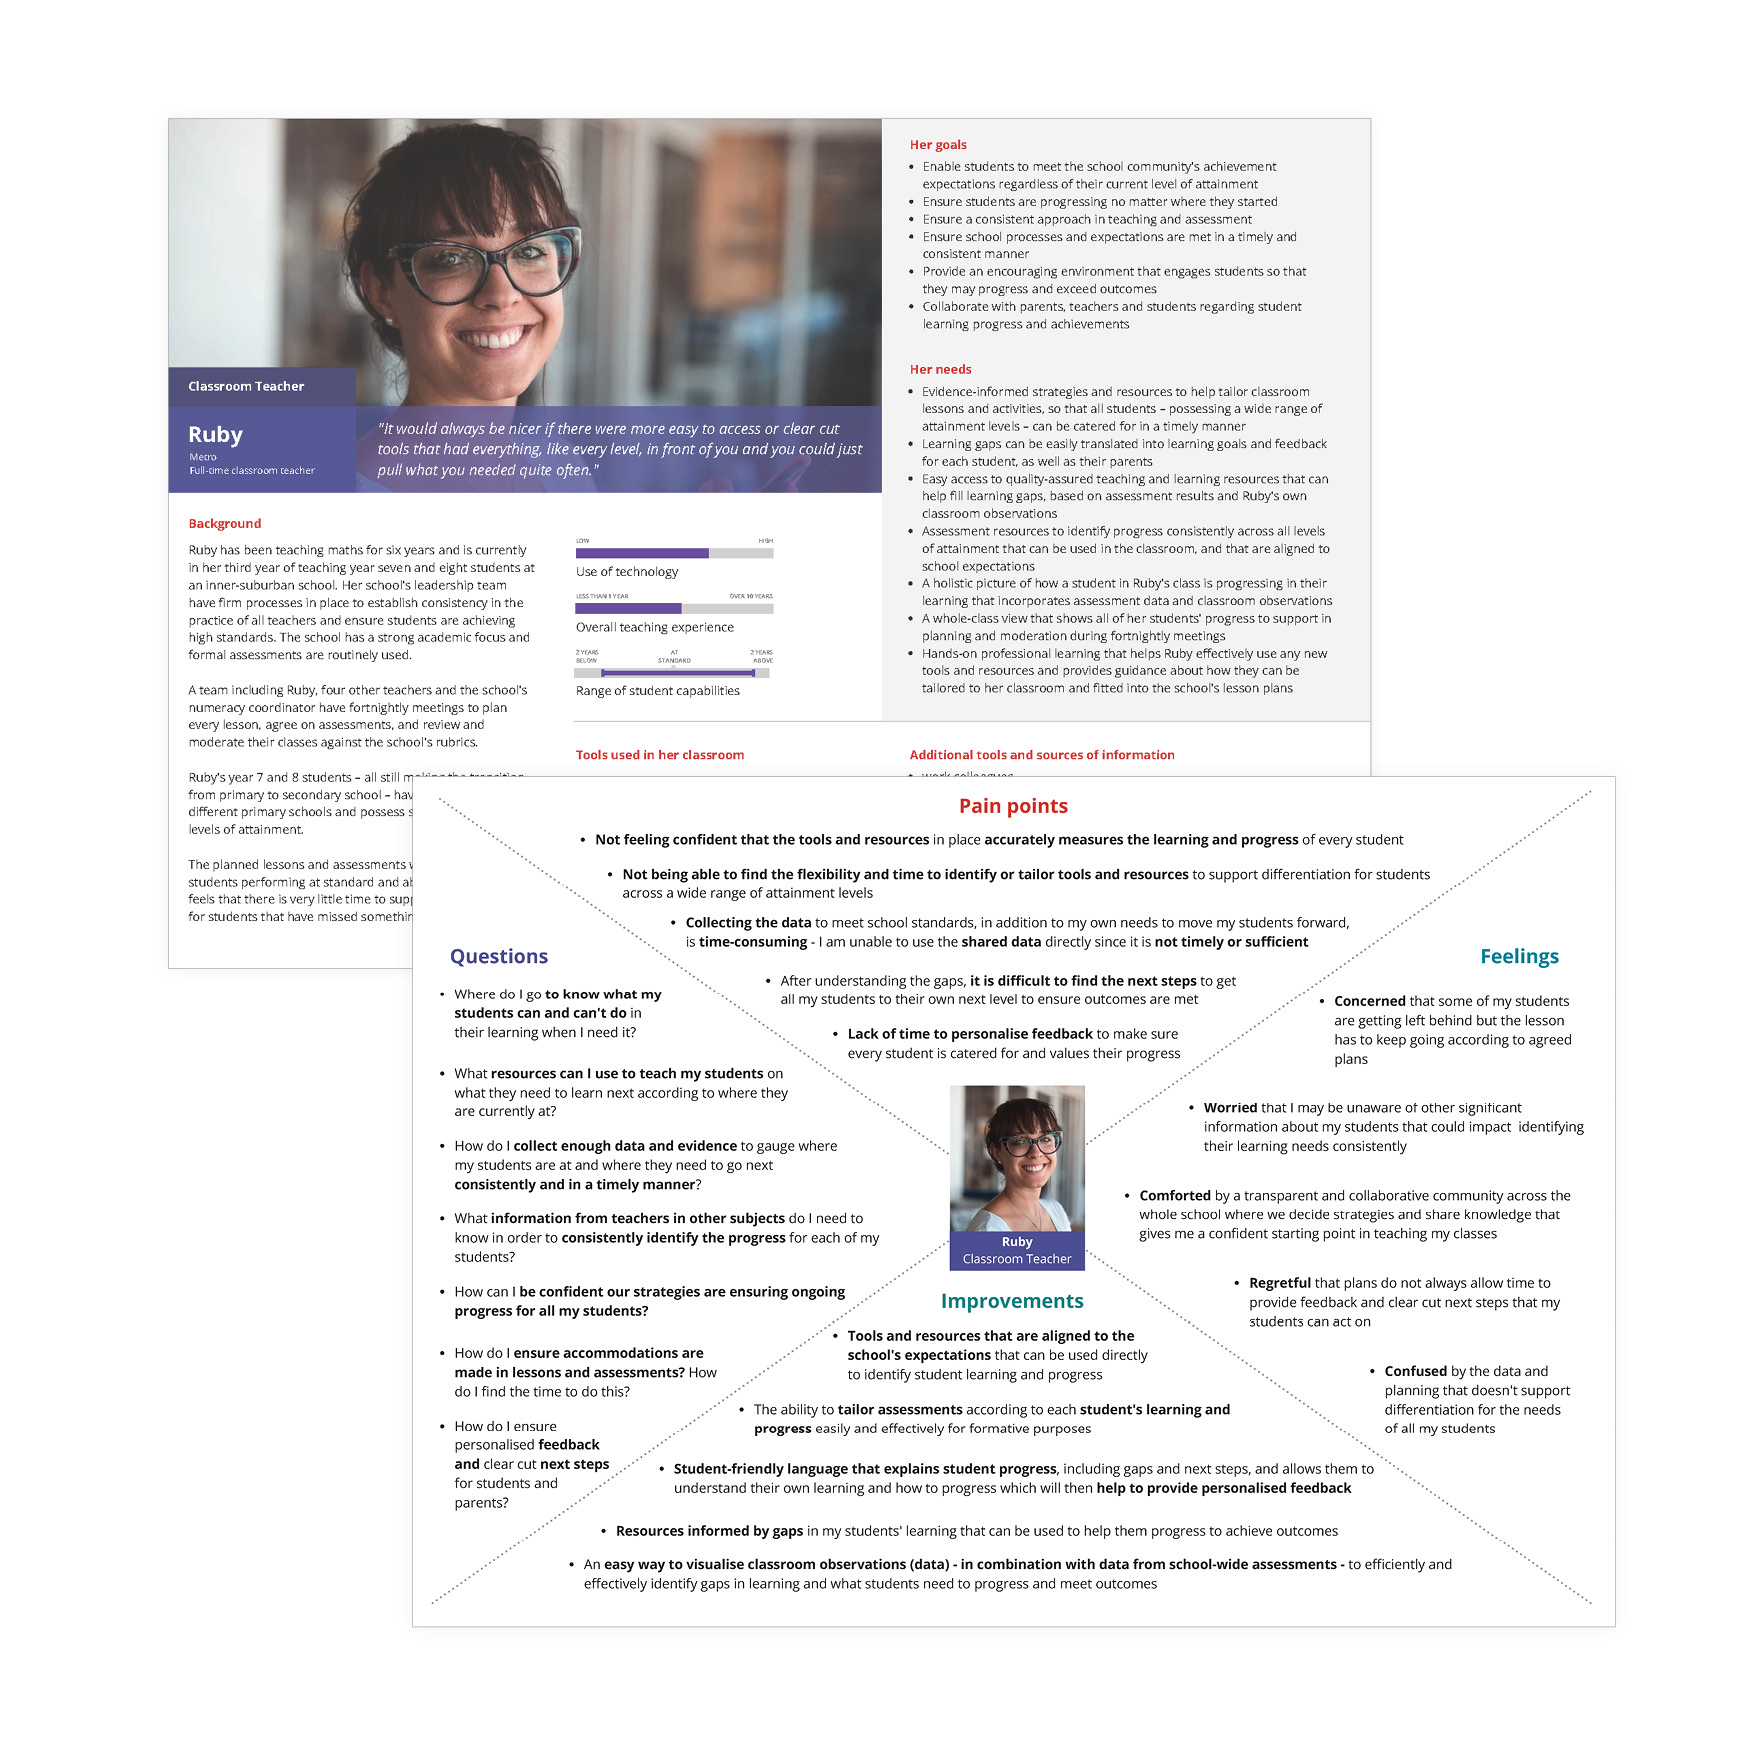
Personas and empathy maps
12 key audience personas emerged from the findings of discovery. These will referred to in future phases of the service design and delivery process, and will be key in ensuring the users are kept at the centre of a long service design process.
Our personas gave background information, metrics that differentiated each persona, goals, needs, tools being used. On the flip side of every persona is an empathy map, which detailed their questions they look to answer, feelings, pain points and possible improvements that could benefit them.
These proved to be especially useful during our Alpha phase where we had a chance to prototype these improvements, however it also gave our stakeholders a shared understanding of the landscape users were facing.
User journey
4 user journey maps were created based on the same five steps that majority of users went through in their goal to support and achieve student progress. We collated the common actions, needs, sources of information and feelings throughout the journey.
The user journey maps helped stakeholders put themselves in their user's shoes, and was helpful in mapping out the minimum viable product according to the biggest areas of pain in the journey, which is the goal of the alpha phase.
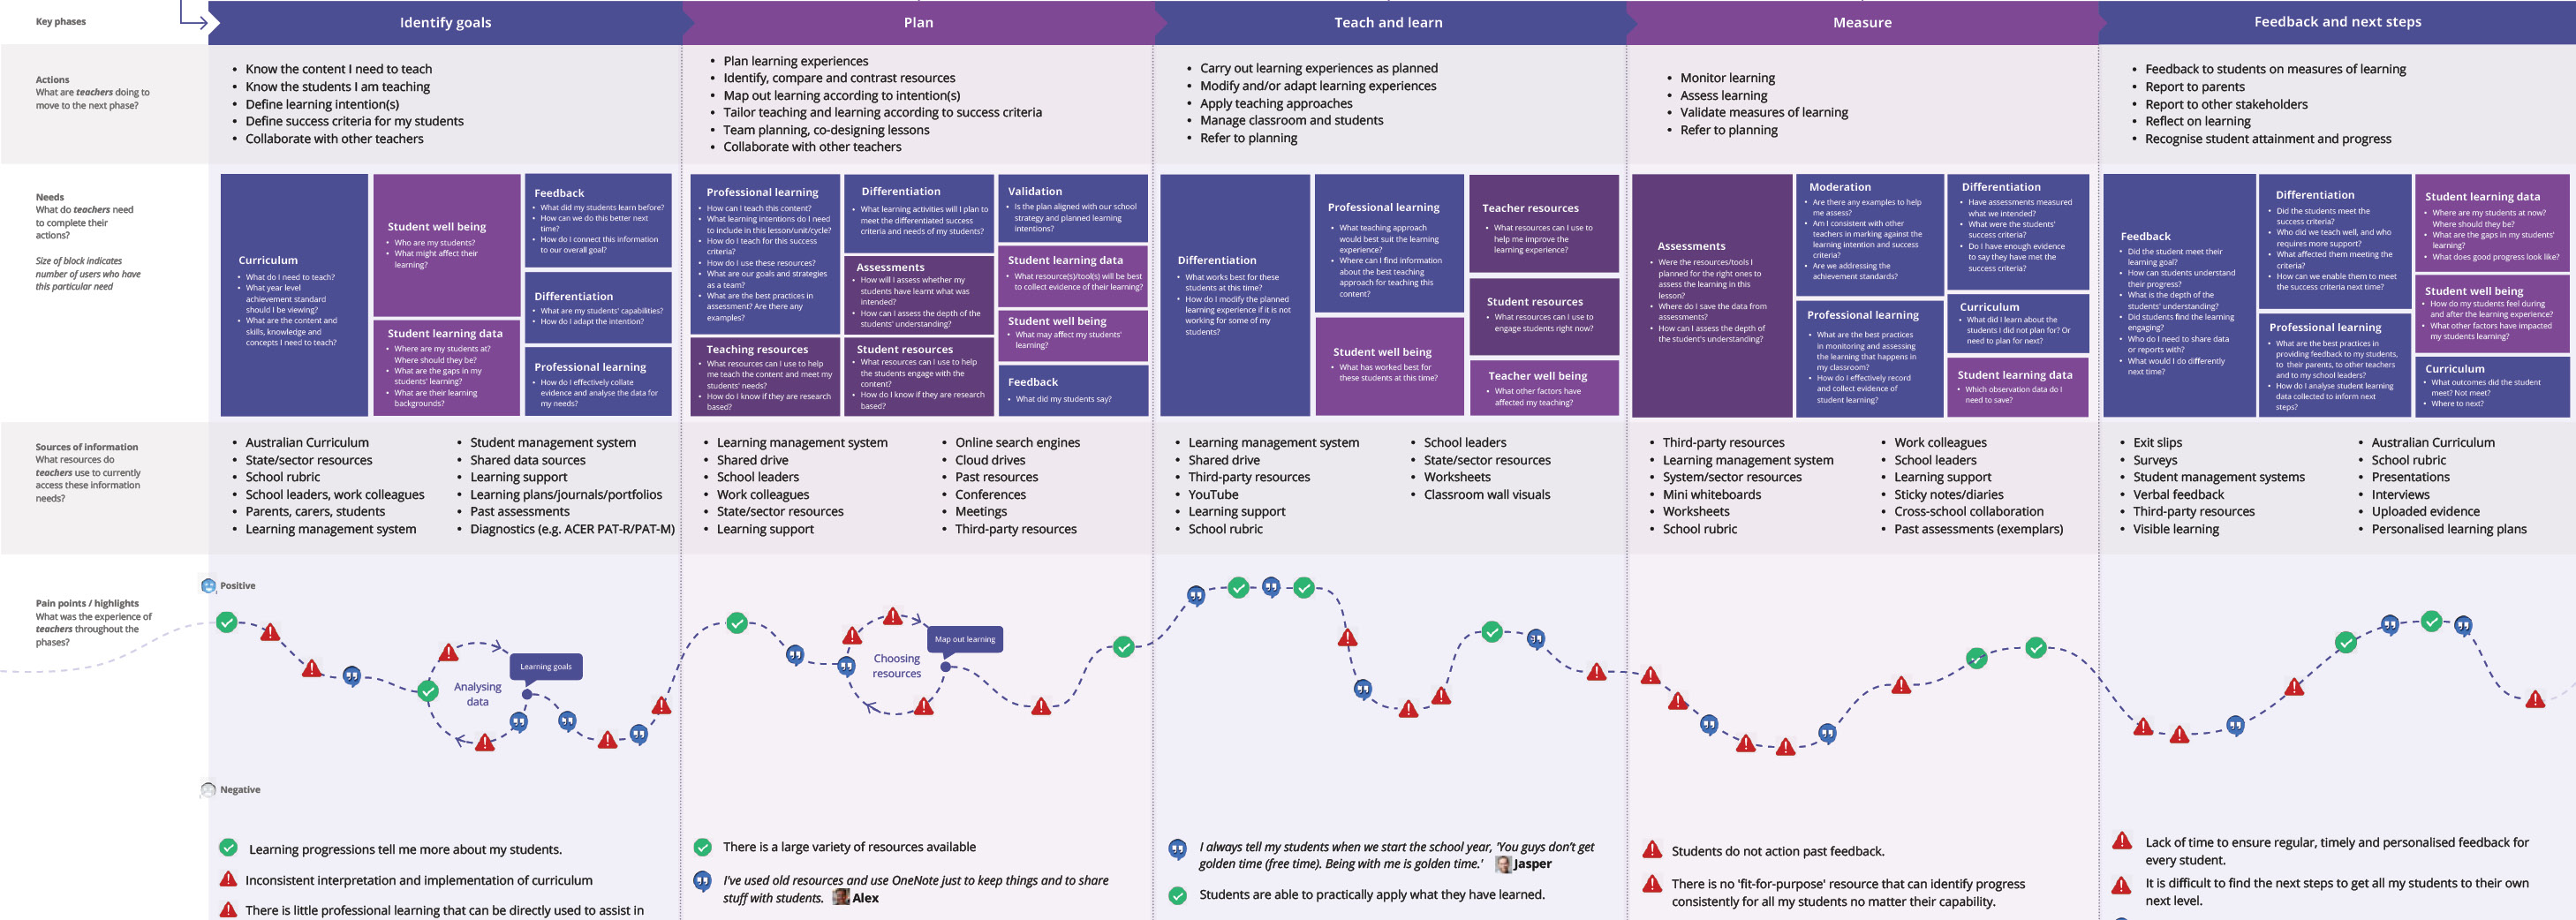
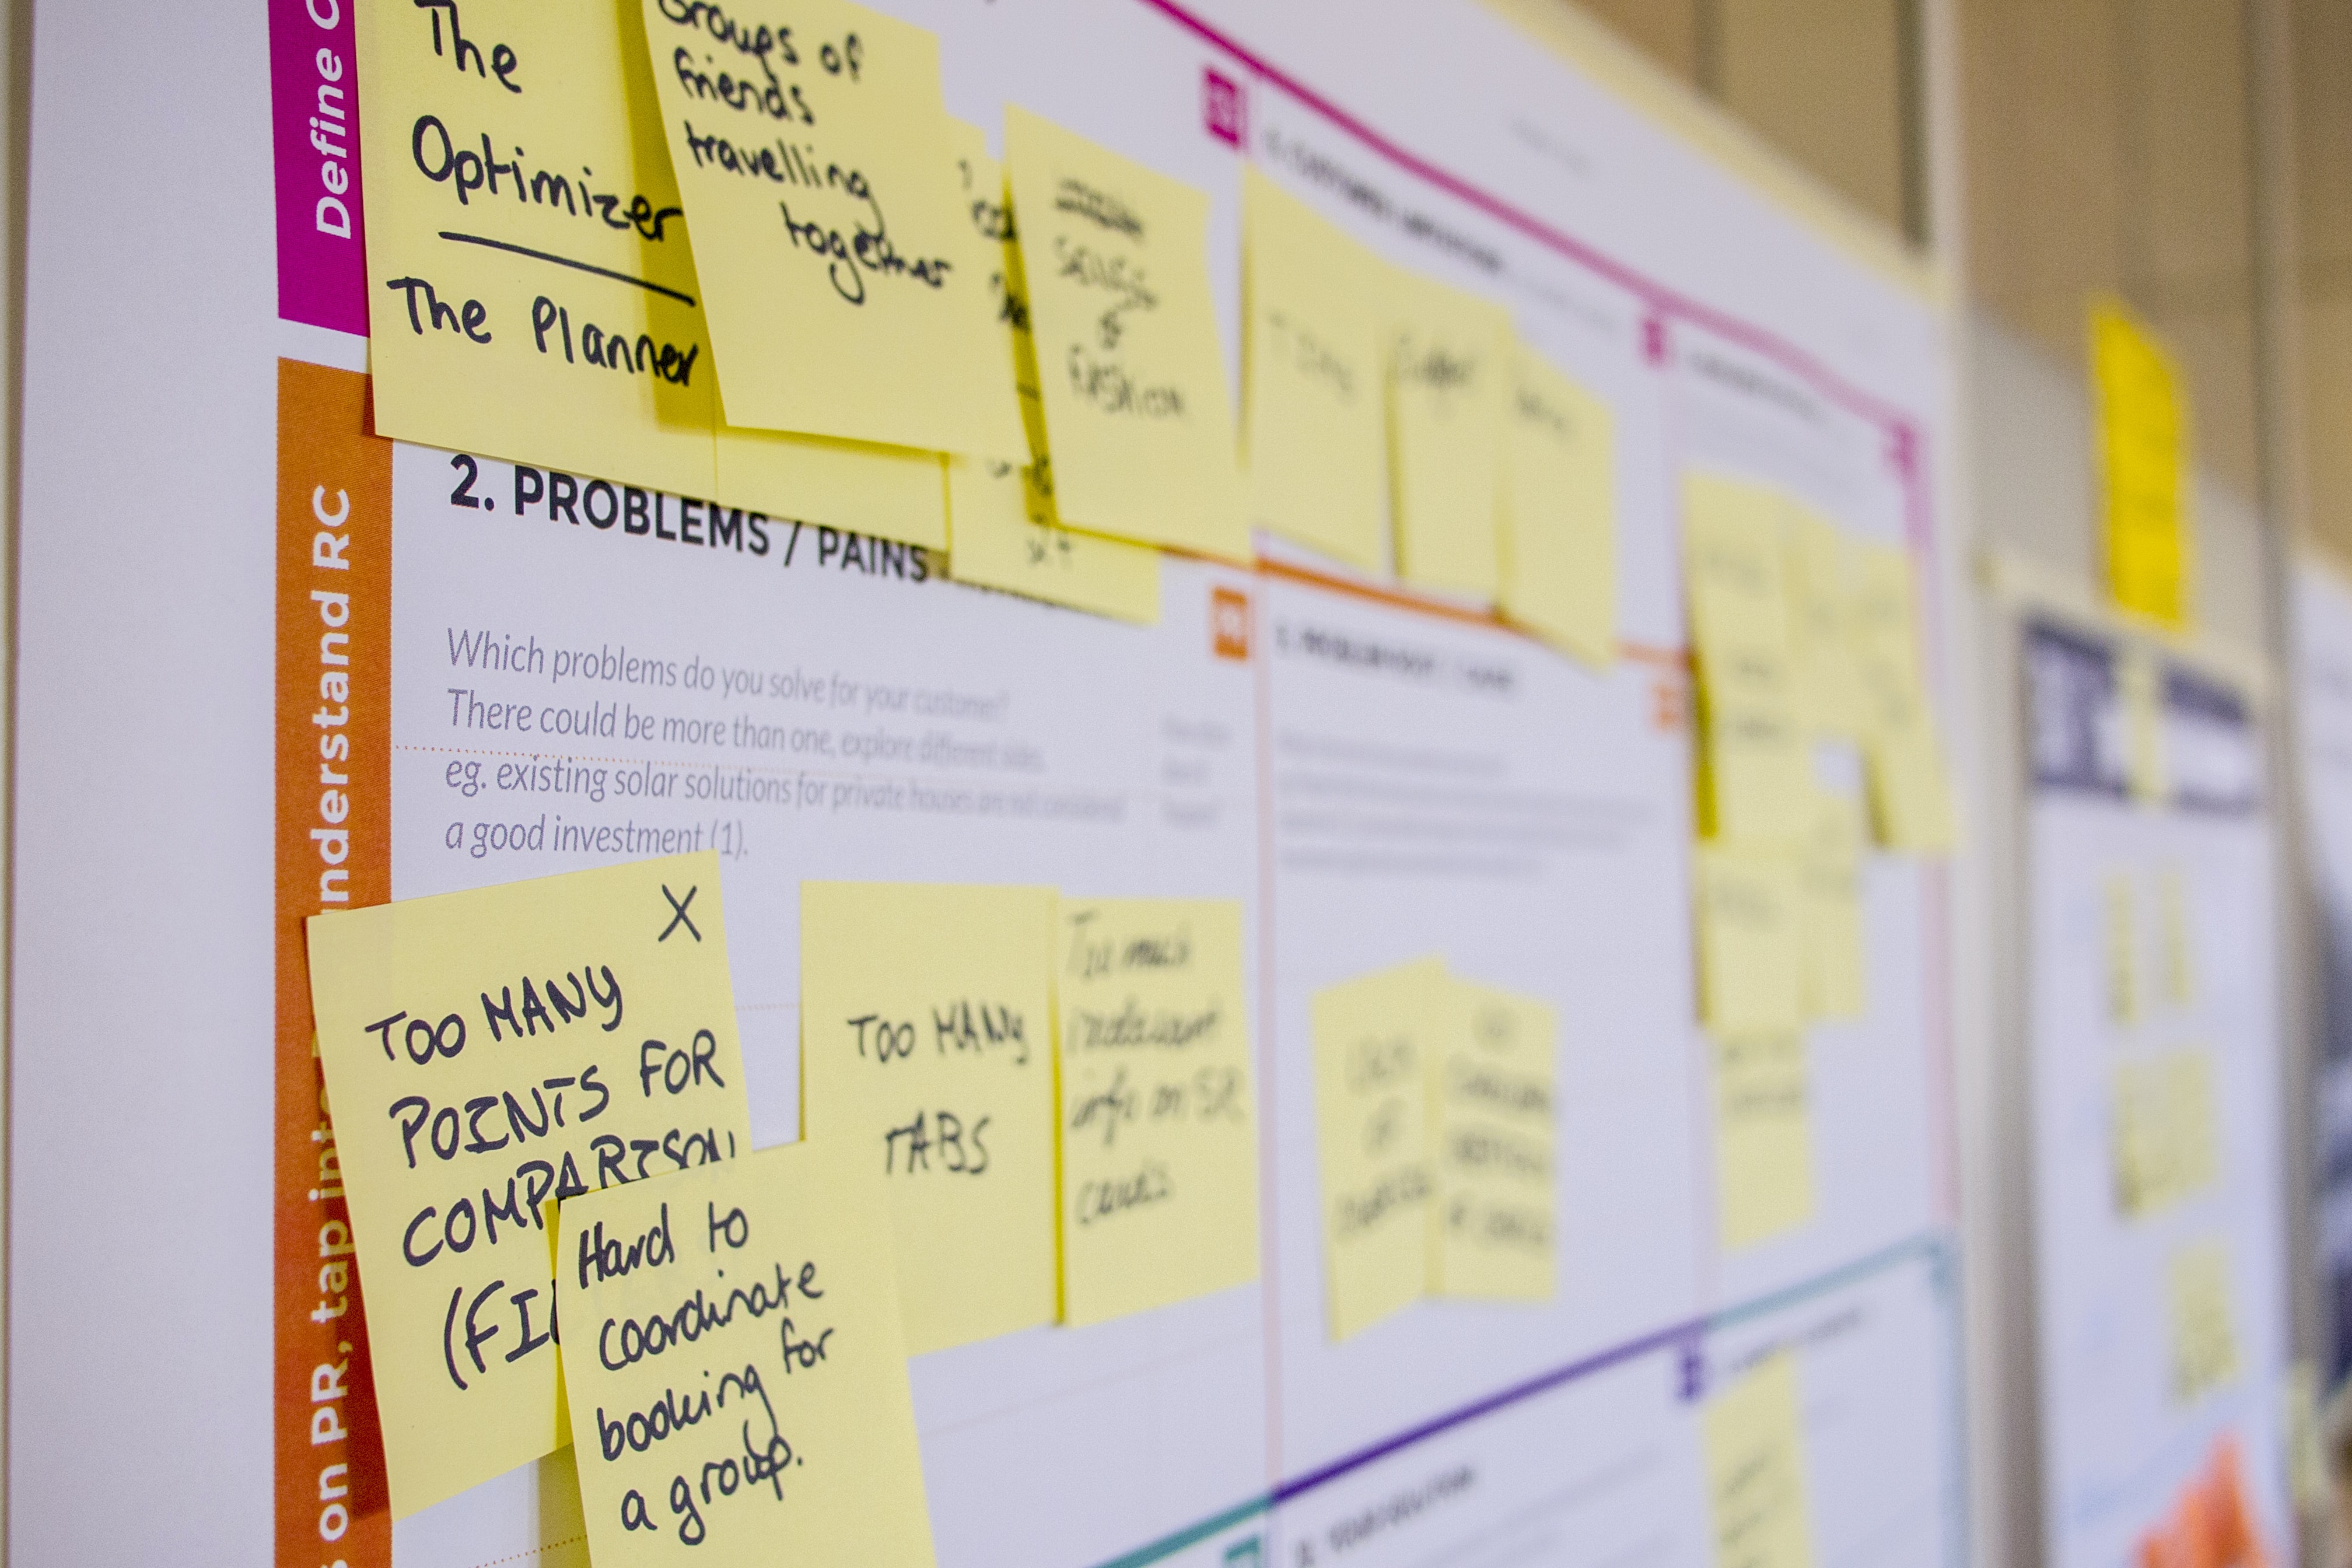
Journey maps and personas are developed collaboratively using Miro
Prioritising collaboratively
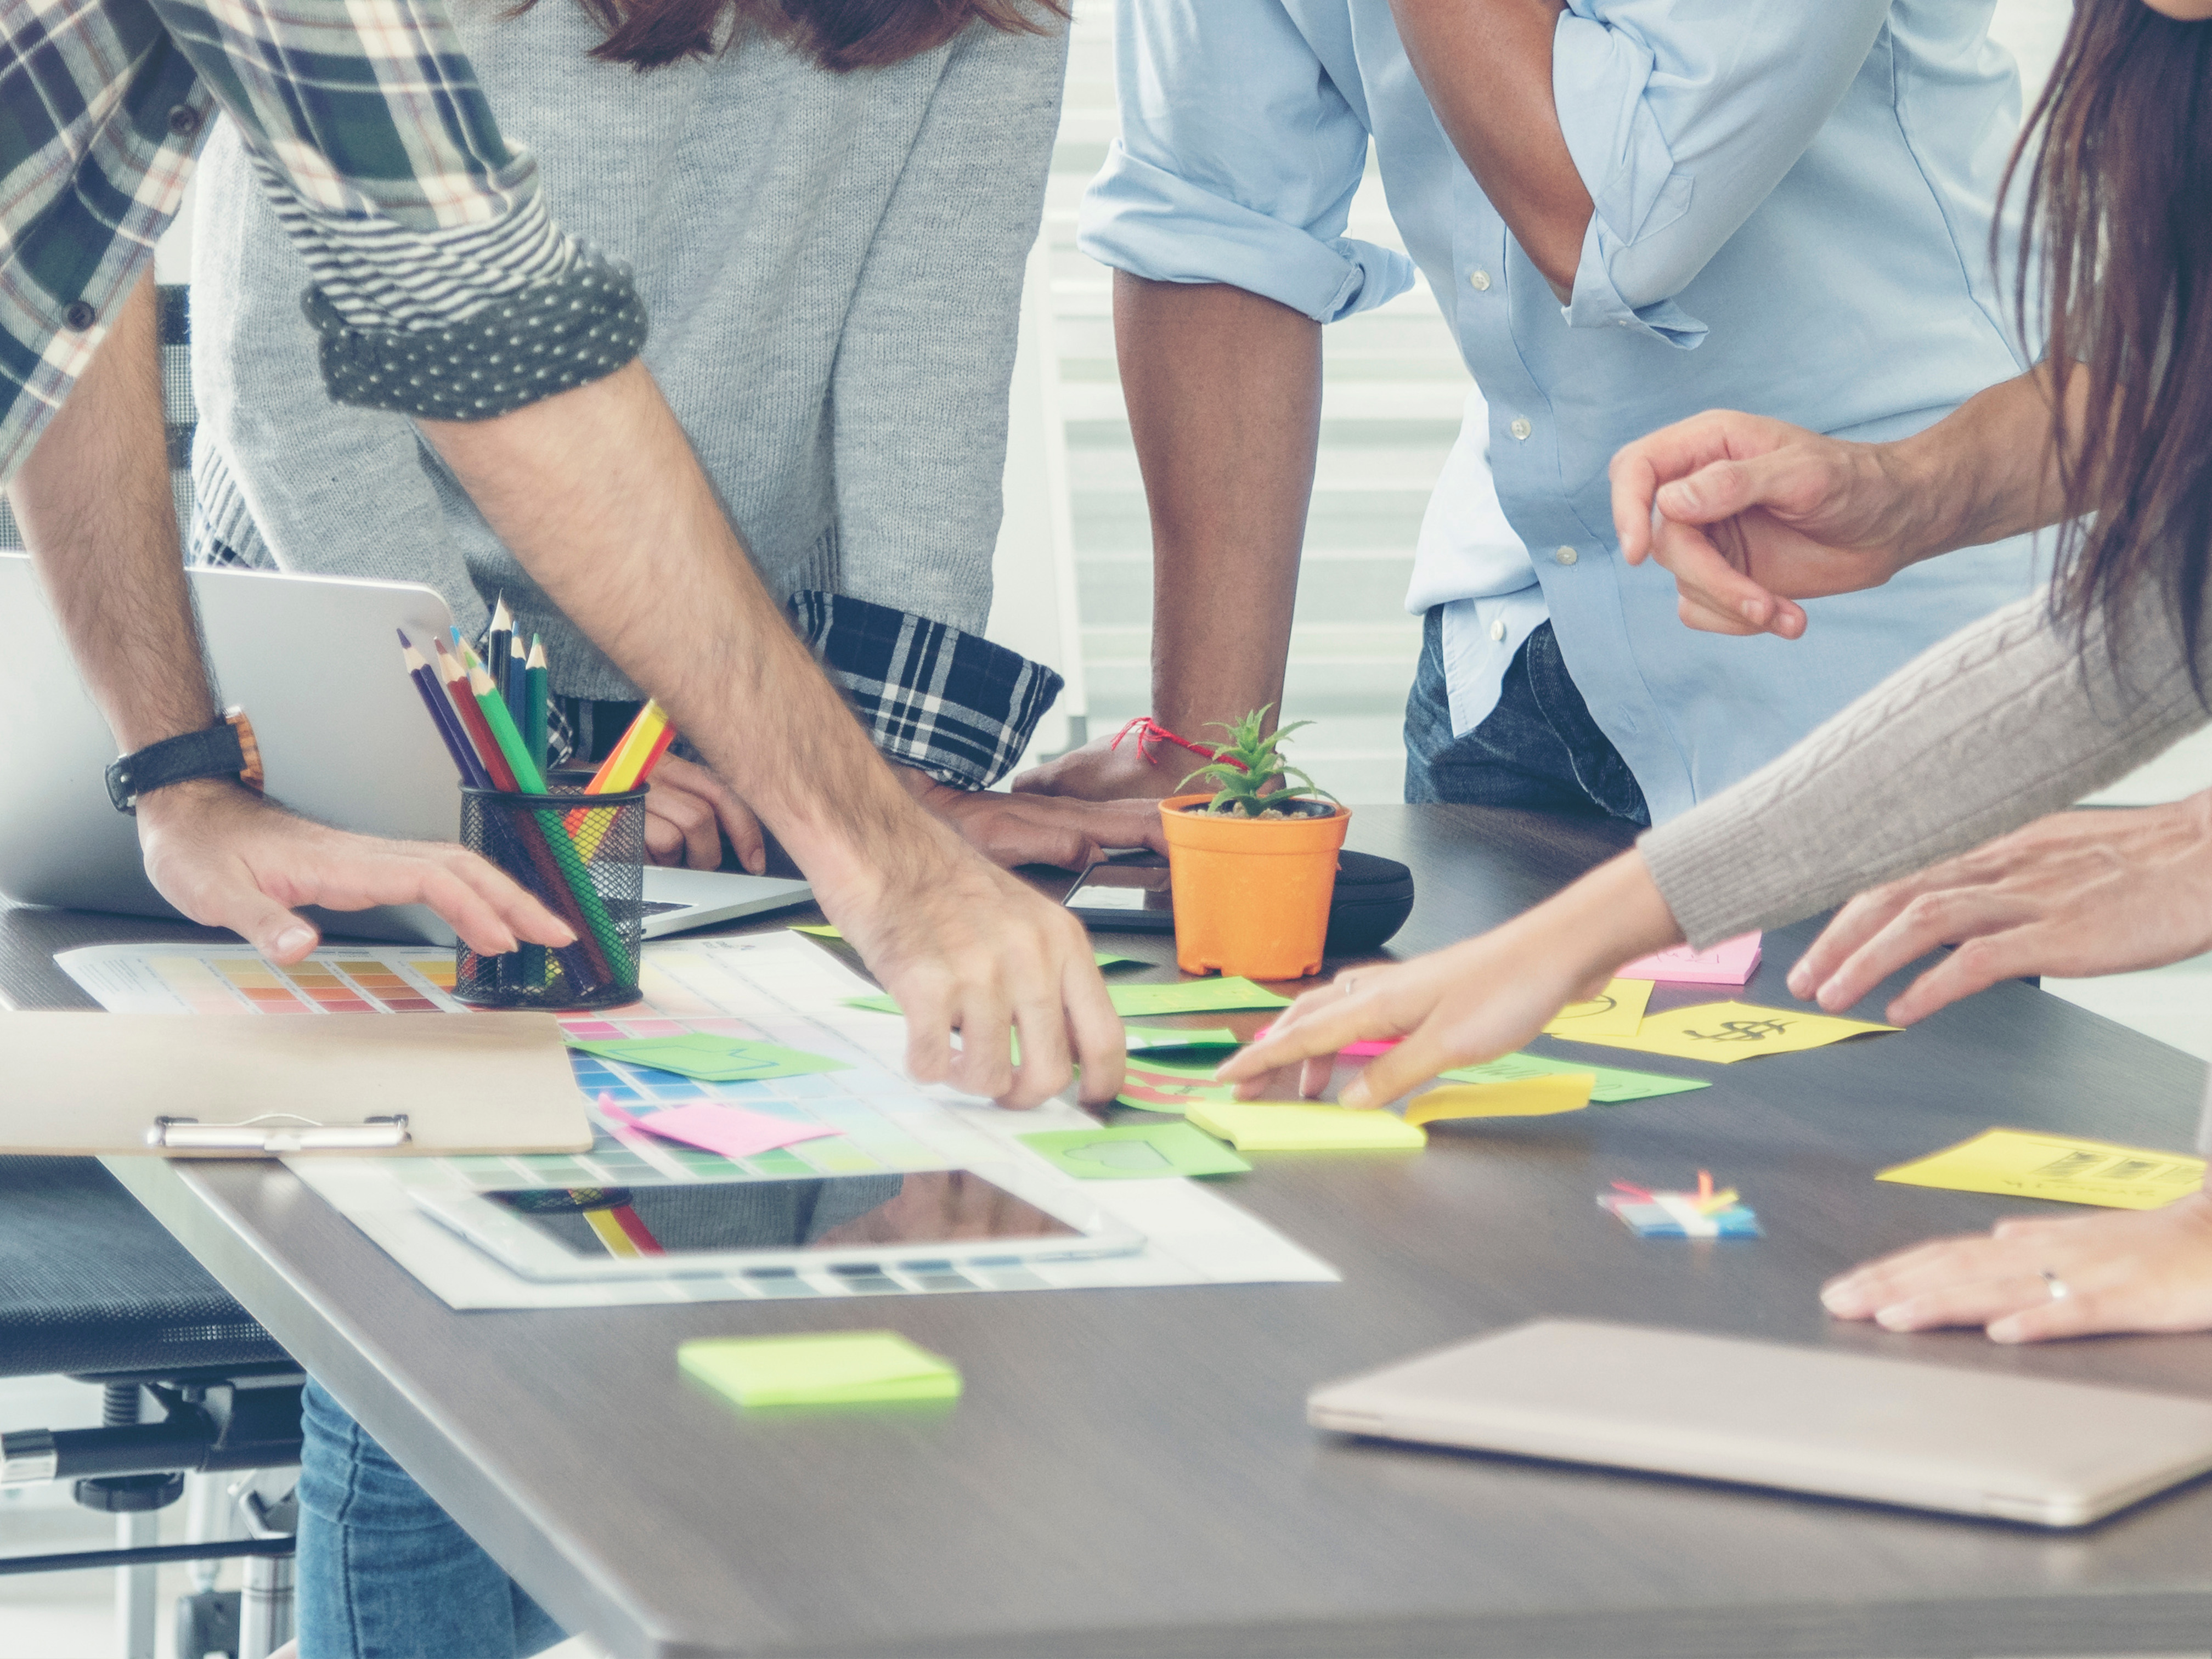
With personas and journey maps in tow, we organised a design thinking workshop with our reference group which would be done in two days. Over those two days, we facilitated five different activities.
This was a very taxing workshop, hence it was held over two days to give users time to define the problem and create a solution. Both sessions were enlightening, giving users a chance to voice out their solutions as well as illustrate them provided different points of view and discussion, and provided the design team the validation to present their insights to external stakeholders. The insights from this workshop fed right back into the personas and user journeys, as well as the final output, a list of findings and recommendations to move to the next phase of design.
Prioritising pain points
In part one, we would work together to narrow down to the biggest pain points, and categorise them into high level user needs. Our users gave feedback on the personas and journey maps via gallery walks, and with some card sorting they sorted the pain points into categories. It was delightful (and a relief) that they came to the same conclusion we did.
How might we...
The high level user need categories became the essence of a series of ‘How might we…’ statements to be used in the second part of the workshop where members were asked to provide ideas to address the largest paint points.
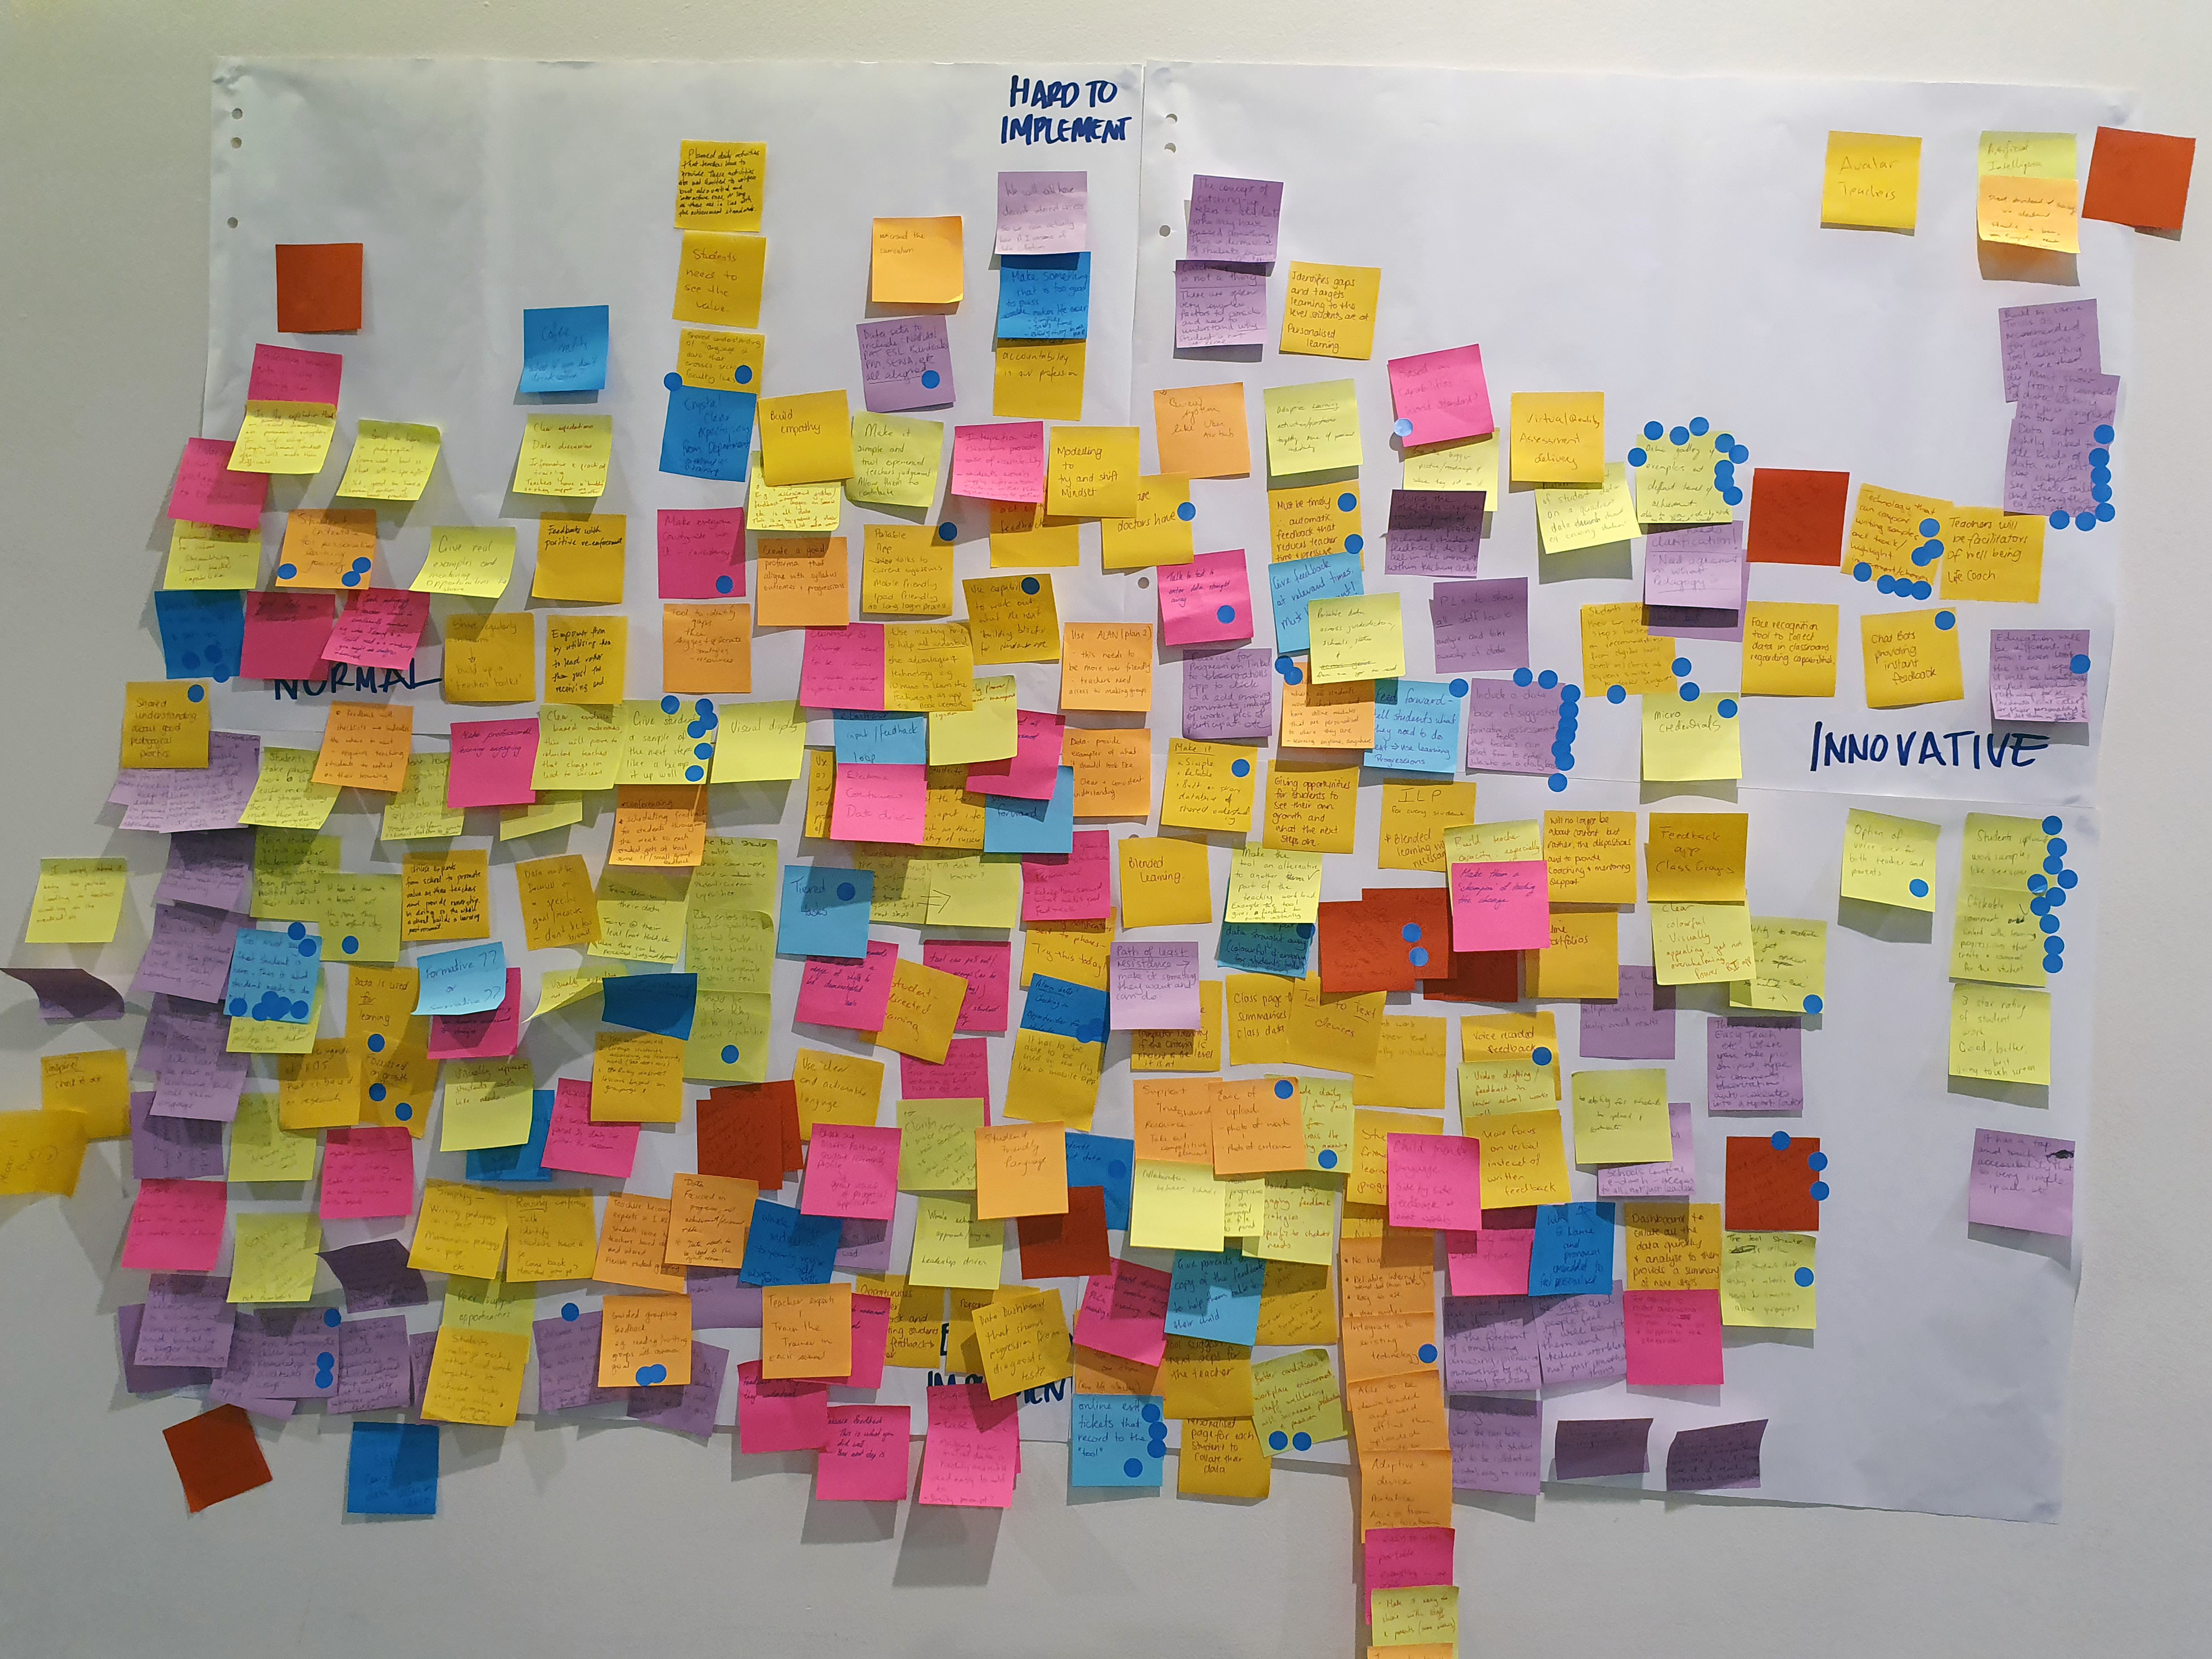
Idea evaluation matrix
Afterwards, they evaluated their ideas by mapping them based on innovativeness, feasibility, and value on an idea evaluation matrix. To further prioritise the many ideas our users came up with, they were given three stickers to use on the ideas they felt they would find most useful.
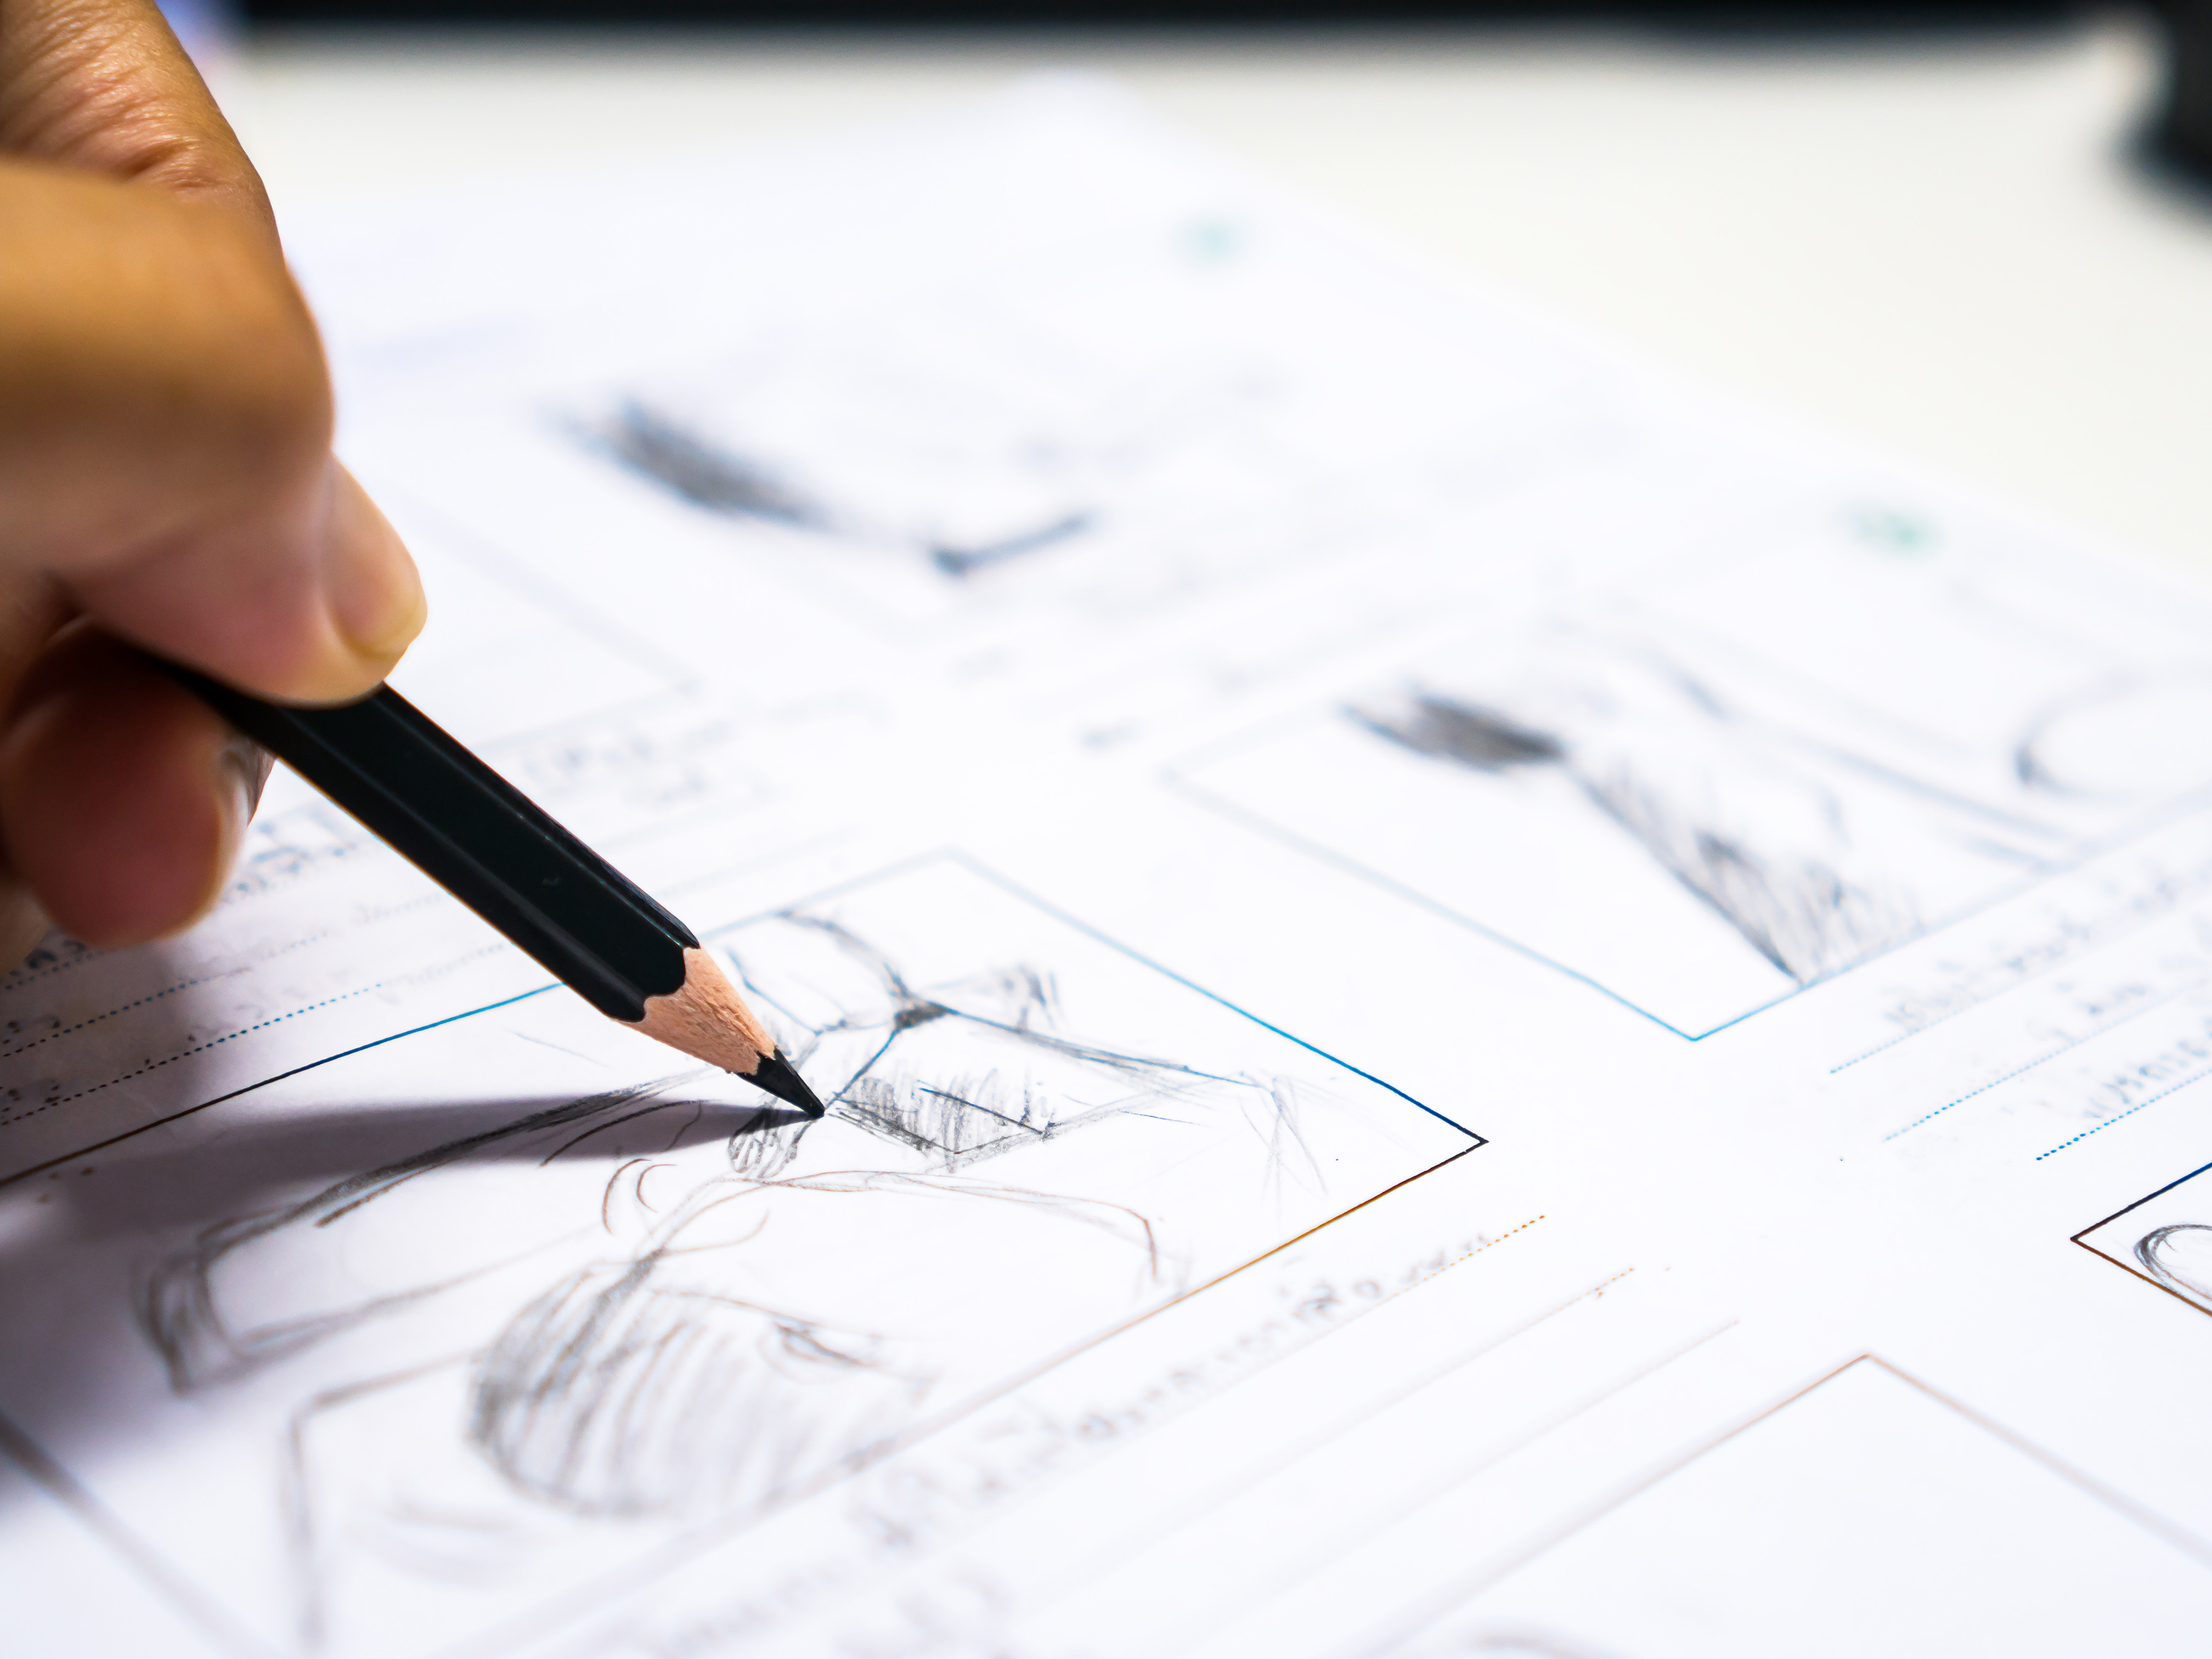
Storyboarding
For the final activity, users chose one of the personas and ideas to create a storyboard of how the ideal experience would look like to them.
Findings and recommendations
14 key findings were presented as a summary of the state of teaching and learning and how it supports student progress. These were further refined to eight common themes of high-level user needs.
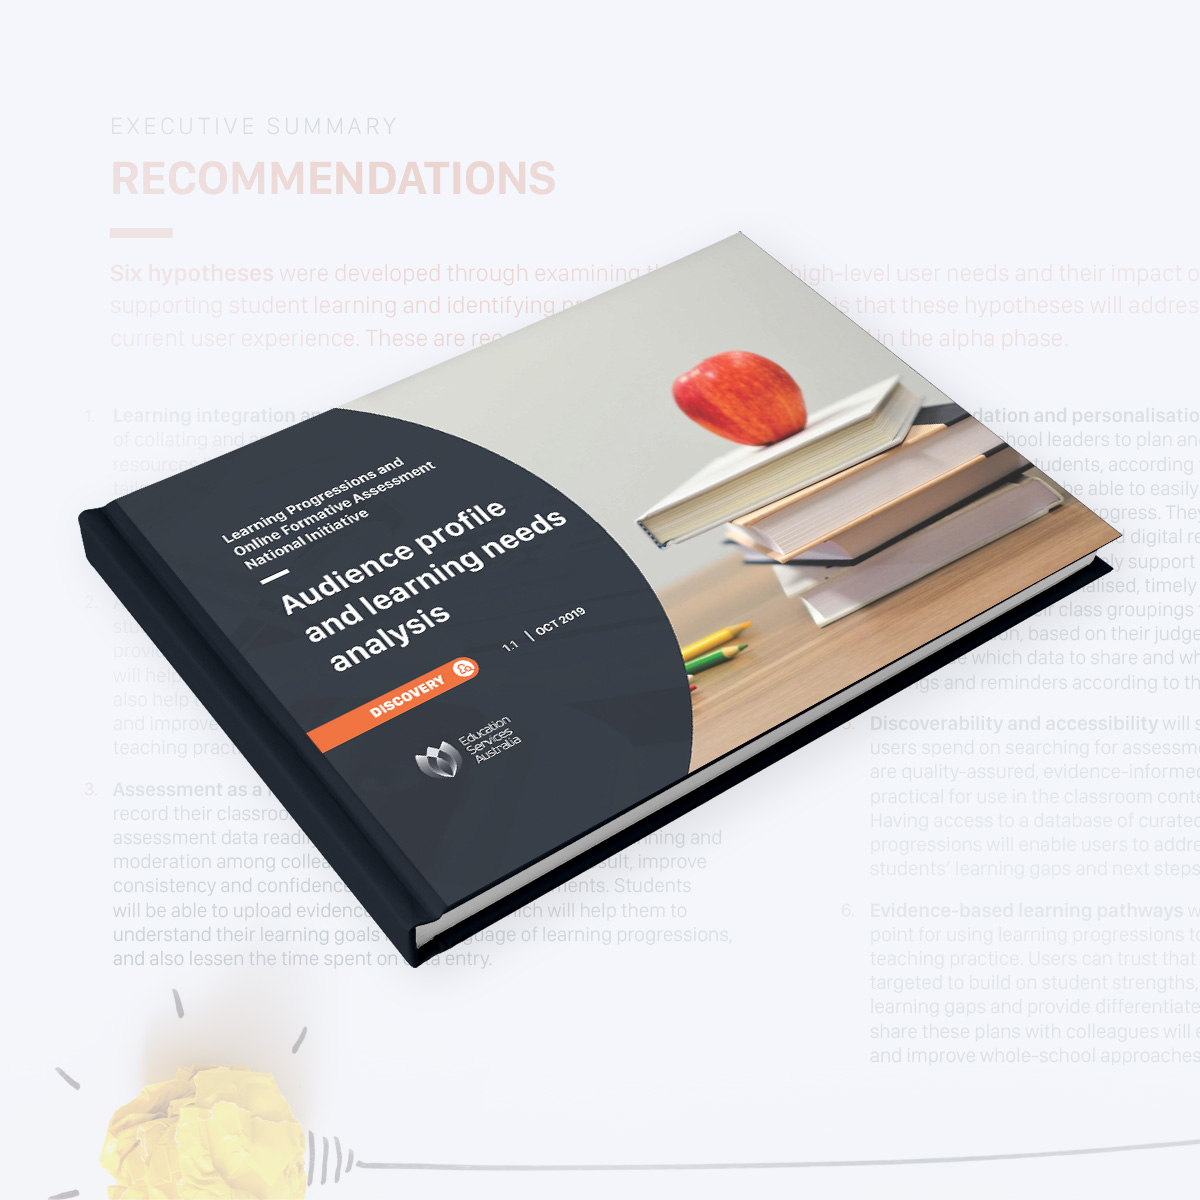
Based on these user needs, 6 hypotheses were developed as a starting point for how to solve the problems users were experiencing. These were broken down into a set of initial requirements and user stories to become functionality to test in latest phases.
The final recommendation was to test these hypotheses in the next phase with a combination of users from discovery and new users to validate if the proposed solution meets the user needs.
Lessons learned
The most challenging, as well as the most fun, part of this project was the subject matter at hand, teaching, learning and its relationship to student progress. It was amazing to see and learn about the frameworks teachers and school leaders used to encourage this process, although our project focused on learning progression, it entwined with all aspects of teaching and learning.
Navigating the way a national curriculum framework worked, how it worked alongside state frameworks, and then making its way into the framework each school and individual teachers worked was something that we learned on the go. Now it is a part of my strength as a designer, where I understand better how users can retain skills they engage with during their experiences.

What happened next?
The final Audience Profile and Needs Analysis report we provided was collated with findings from our agencies in different streams and shared to various stakeholders. The Education Council eventually approved going forward to the Alpha phase as they were convinced the need for a solution was evident. Now we would have the opportunity to test out our hypotheses with users in wireframes and prototypes.